
Key Takeaways
- The TikTok analytics dashboard works as a decision tool that answers clear questions about views, engagement, and follower growth.
- Creator and Business accounts see different analytics, and Business accounts gain CSV exports, conversion data, and post scheduling.
- Each dashboard tab (Overview, Content, Followers, and LIVE) focuses on specific metrics such as watch time, traffic sources, demographics, and live performance.
- Data refreshes roughly daily, some metrics appear after 24 to 48 hours, and detailed post-level data only stays available for a short window.
- Sozee turns TikTok insights into concrete actions by combining analytics, scheduling, and AI content tools in one workflow.
See What Your TikTok Data Can Do
How To Access Your TikTok Analytics
Analytics are available to Creator and Business accounts. Personal accounts must switch account type to enable analytics access, and the switch is free. Detailed audience data in the Followers tab requires at least 100 followers.
Mobile path:
- Open TikTok and go to your profile.
- Tap the menu bars in the top right.
- Select TikTok Studio.
- Tap Analytics.
Desktop path:
- Log in to TikTok Creator Dashboard.
- Open the Analytics tab on the left menu.
- Or visit tiktok.com/tiktokstudio/analytics directly.
The desktop version shows larger detailed graphs, clickable tabs and dropdown menus, and supports direct CSV export. This layout suits deeper analysis better than the mobile view.
What TikTok Analytics Actually Show You
TikTok organizes native analytics into four primary sections: Overview, Content, Followers, and LIVE. Each section explains a different layer of what is happening with your account and content.
Overview Tab
The Overview tab shows account-level totals across a selected time window of 7, 28, or 60 days, or a custom range.
- Views: Views measure total video plays in the selected period, so they show whether your content is being seen at all. If views are flat, use the Content tab to spot specific posts that underperformed.
- Profile Views: Profile views count how many people visited your profile after seeing a video. If video views are high but profile views stay low, tighten your hooks and update your bio so viewers feel a clear reason to click through.
- Likes, Comments, Shares: These totals show how often people react to your content. If shares spike on a specific format or topic, create more posts that follow the same structure or theme.
- Follower Growth: Follower growth tracks net change in followers over time. If views rise but followers stay flat, your profile is not converting visitors into followers, so refine your bio and pinned videos.
TikTok does not calculate an engagement rate for users. Calculate it yourself by dividing total interactions by views or by follower count, depending on your reporting goal.
Content Tab
The Content tab shows per-video performance and helps you understand which posts actually drive results. Some individual post metrics are only available for the past seven days, so check in regularly to keep that detail.
- Total Watch Time: Total watch time adds up all viewing time across every play of a video. Comparing this number across posts highlights which formats hold attention long enough to matter.
- Average Watch Time: Average watch time divides total play time by the number of views. If this number stays low on short videos, strengthen the first one to two seconds so viewers stay instead of swiping away.
- Traffic Sources: Traffic sources show where views came from, such as For You, Search, Profile, Following, or Sound. If Following dominates, sharpen your topic and retention so the algorithm feels confident pushing you to For You.
- Viewer Demographics: Demographic data covers age, gender, and top territories for viewers. Use this to match topics, references, and posting times to the people who already watch you most.
Followers Tab
The Followers tab focuses on who follows you and when they are active. As noted earlier, detailed audience data appears once you reach 100 followers.
- Follower Demographics: Demographics show follower age, gender, and top countries and cities. Align your content themes and offers with the interests and context of this core audience.
- Active Hours: Active hours chart when your followers are most active by hour and day. Schedule posts during peak activity windows for your audience instead of relying on generic best-time lists.
LIVE Tab
The LIVE tab is only available to accounts with LIVE access and shows stream-specific data.
- Total Views: Total views count how many times your live sessions were watched. If this number stays low, promote your live sessions in advance with short teaser clips.
- Unique Viewers: Unique viewers count how many individual accounts watched the live or at least one video from the project. If unique viewers are high but new followers stay low, add more direct follow prompts during the stream.
- New Followers Gained: This metric shows how many followers you gained during the live. If conversions stay low, clarify your value, recap key points, and invite viewers to follow before you end.
- Top Concurrent Viewers: Top concurrent viewers show your peak simultaneous audience size. Use the timestamp of that peak to plan future live start times.
- Diamonds/Virtual Gifts: Gifts track how much your live sessions monetize where this feature is available. If gifts remain low, interact more directly with viewers and reward participation.
TikTok Creator Account vs Business Account Analytics
Account type changes how your analytics dashboard looks and what data appears. TikTok defines three progressive entitlement levels: a General TikTok Account, a TikTok Account with Advanced Access, and a Verified Business Account, with analytics access expanding at each level.
| Feature | Creator Account | Business Account |
|---|---|---|
| Analytics Access | TikTok Studio | Web Business Suite |
| Overview Metrics | Views, profile views, likes, comments, shares, follower growth | Reach, engagement, conversion, followers |
| Content Metrics | Per-video performance, watch time, traffic sources | Video performance sorted by newest or most viewed |
| Audience Data | Demographics, active hours (100+ followers) | New followers, gender, age, top countries/cities, activity |
| Export | Limited (screenshots) | CSV download |
| Post Scheduler | No | Yes |
| Conversion Analytics | No | Yes (Verified Business Account) |
The Web Business Suite Analytics tab is split into three reporting paths: Overview, Audience, and Video, each supporting date ranges of Last 7 days, Last 28 days, Last 60 days, or a custom date range. To access it, log in to TikTok Business Suite on desktop and open the Analytics tab.
How Often TikTok Analytics Update
TikTok analytics data may take several hours to fully update after a post is published. TikTok does not publish a guaranteed universal refresh schedule for TikTok Studio analytics. In practice, current guidance describes updates as roughly daily, with some detailed data taking around 24 to 48 hours to appear. Update speed depends on the specific reporting area or tab rather than following one universal schedule across the platform. Some individual post metrics, such as average watch time, total play time, and traffic sources, are only available for the past seven days. For a consistent picture, check analytics at the same time each day and give new posts at least 24 hours before you judge performance.
How Accurate TikTok Analytics Are
TikTok analytics data stays reliable for core metrics such as views, watch time, engagement, and follower counts, but every dashboard has limits. View counts shown on a video in the feed sometimes differ slightly from what appears in TikTok analytics due to data processing delays, because TikTok processes analytics in batches and may lag a few hours behind real-time counts, and some views are filtered out before being counted in analytics, such as views that appear to be bot-generated. TikTok does not calculate an engagement rate for users, so creators must calculate it themselves, and the result changes dramatically depending on whether total interactions are divided by followers or by views. TikTok reporting windows are limited and vary by tab, so year-over-year comparisons require regular exports or a third-party tool that stores history.
What TikTok Shows About Profile Viewers
TikTok analytics focus on totals and trends, not individual identities. TikTok analytics shows total profile views but does not provide a list of who viewed your profile. TikTok has a separate Profile View History feature that shows which accounts visited your profile but provides no counts, trends, or demographics. It only shows visits from the last 30 days, and only when both the profile owner and the visitor have the feature enabled; if either side has it off, the visit remains anonymous. No legitimate third-party tool can reveal this data, and apps claiming to show who viewed any TikTok profile are scams or data grabs.
How To Read View Counts Without Benchmark Anxiety
Whether 20,000 views on TikTok is a strong result depends on account size and niche, because it can be a win for a newer account but below average for a large established account. Focus on your own view trends over time instead of comparing to other creators. A video with 600K views, a 10% completion rate, and no follower growth is strategically less valuable than a video with 35K views, a 68% completion rate, and 700 new followers. Read view counts alongside completion rate, average watch time, and follower growth. The useful question becomes whether a video moved your account forward, not whether the raw view number feels big.
Where TikTok’s Built-In Dashboard Ends
The built-in TikTok analytics dashboard tells you what happened on TikTok, but it cannot show cross-platform performance or distinguish scheduled posts from manual ones. Third-party TikTok analytics tools add competitor and benchmark data, cross-platform reporting, historical data beyond TikTok short reporting windows, client-ready reports, alerting, and social listening, but they still follow TikTok API limits for a user account. A custom dashboard, or a platform like Sozee that includes analytics alongside scheduling and content creation, connects those pieces so your TikTok data informs your entire content system.
How Sozee Turns TikTok Analytics Into Action
The TikTok analytics dashboard shows what worked. Sozee helps you repeat and scale those wins without burning out.
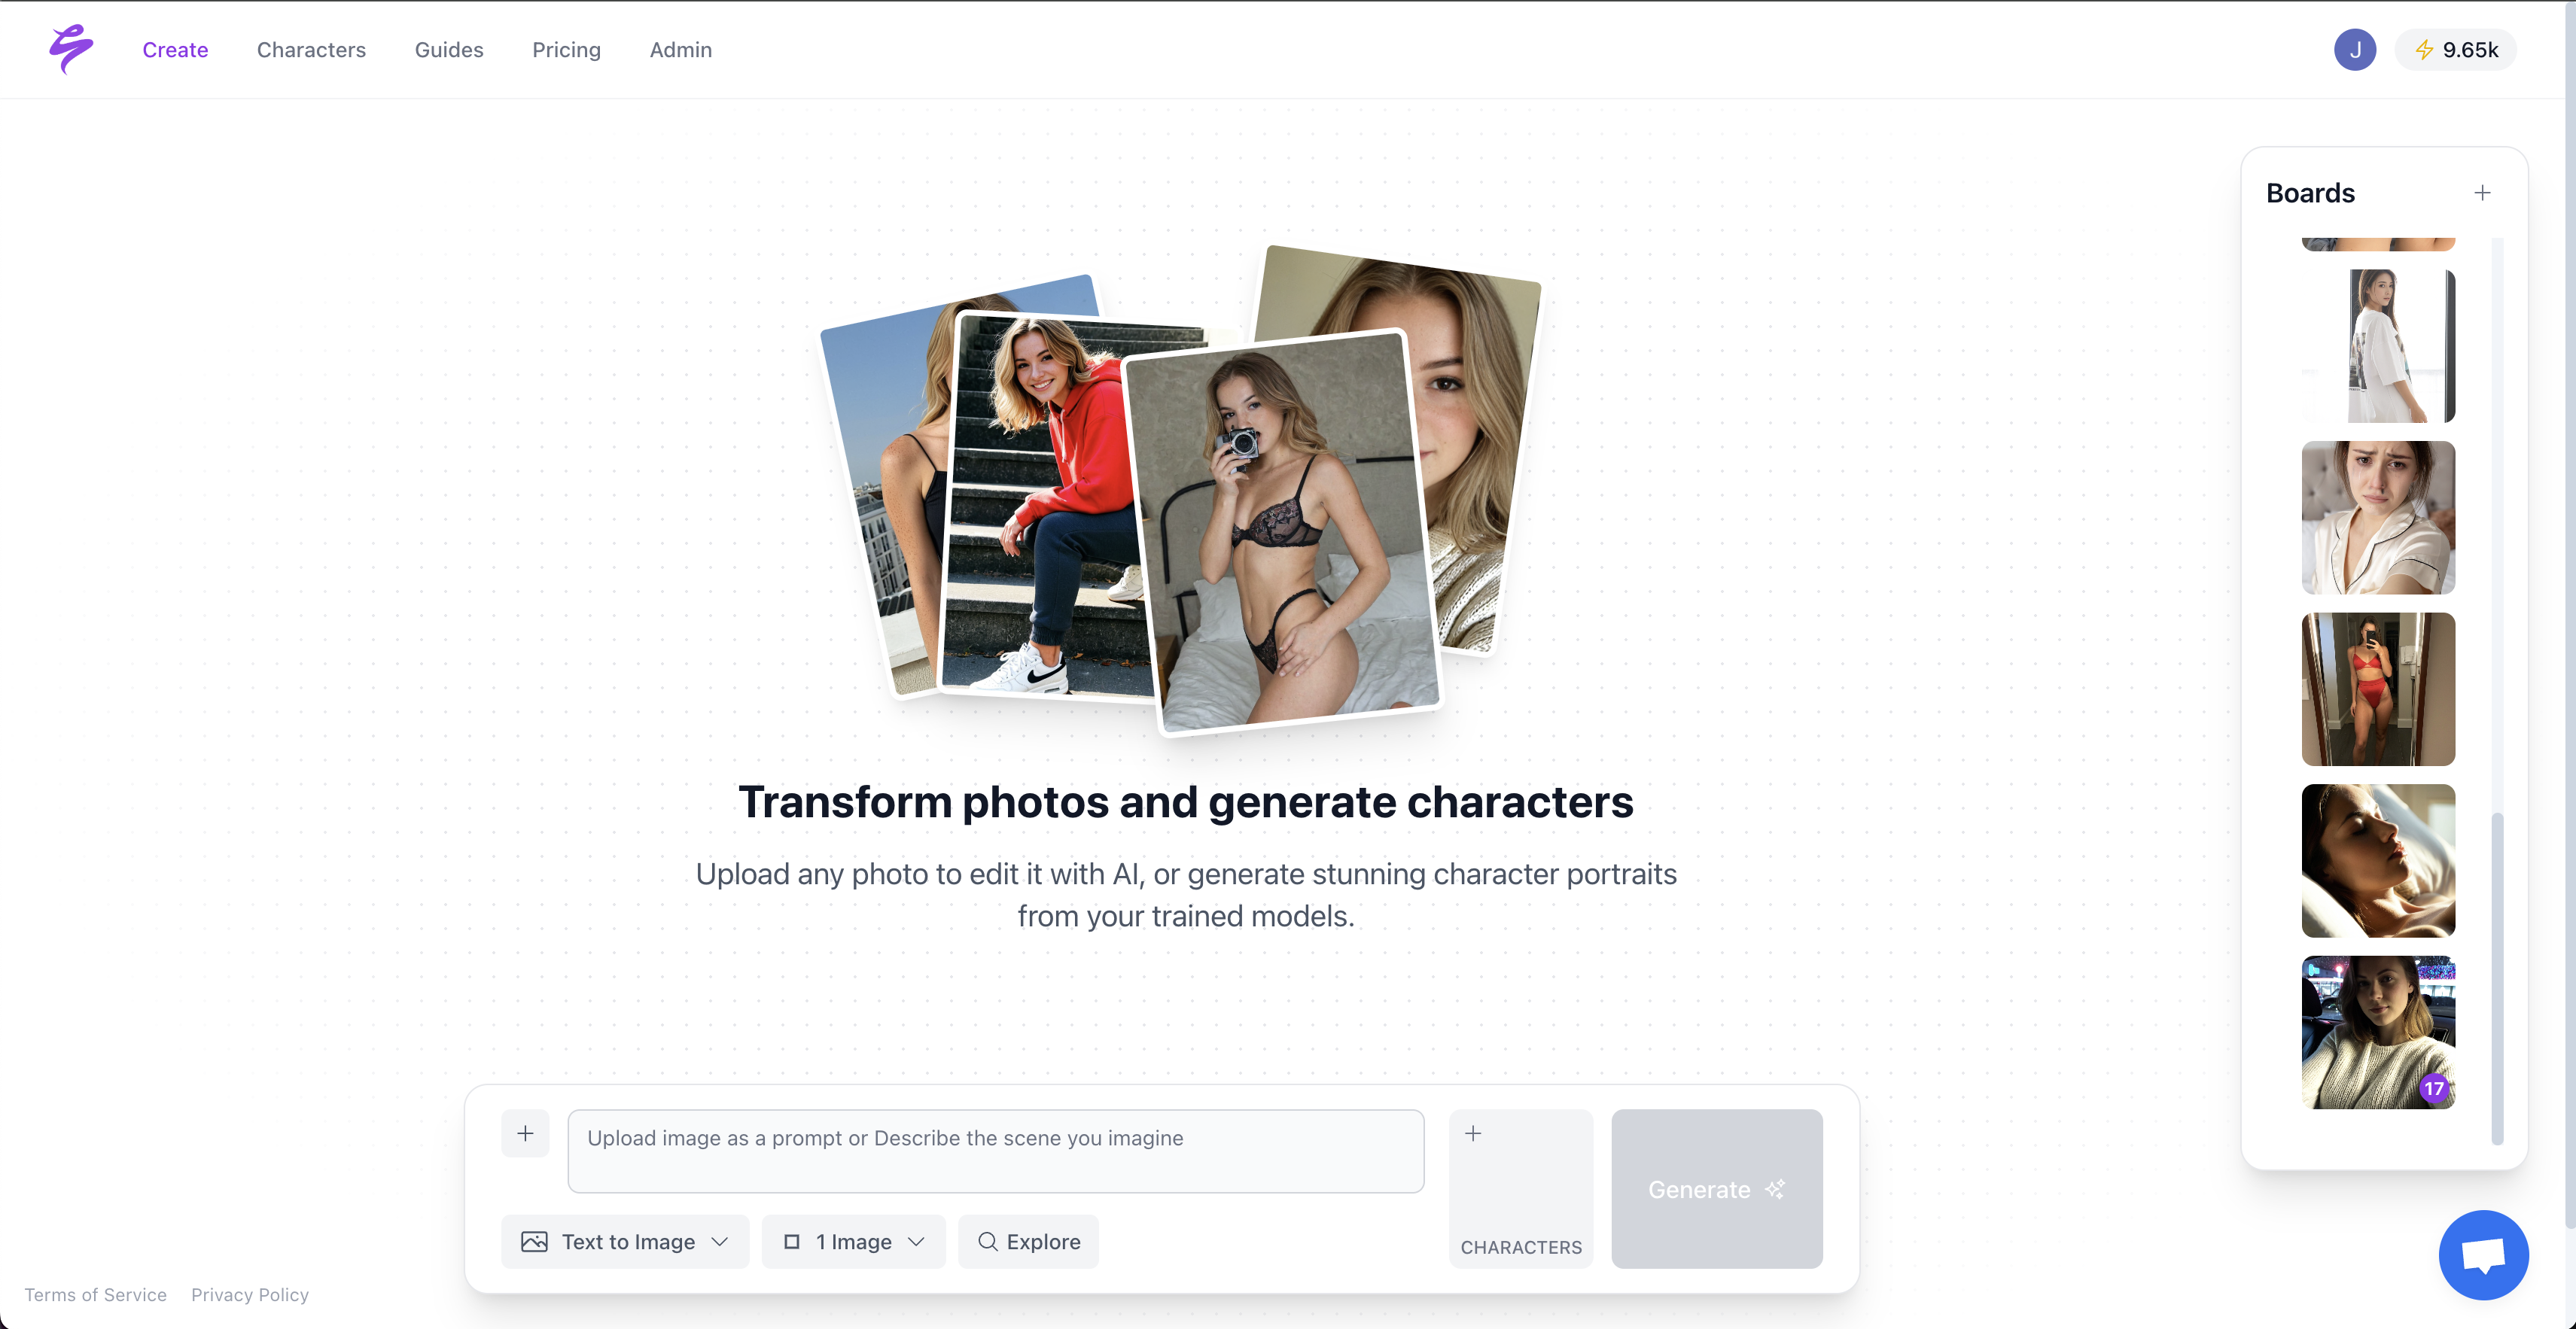
- Scheduler: Connect Instagram, TikTok, X, Facebook, Reddit, and Fanvue per character. Schedule photos, carousels, reels, and stories, each with its own caption and a live preview.
- Analytics: Track impressions, reach, likes, comments, shares, and engagement. See a clear split between what Sozee posted and what you posted, so you can measure Sozee’s contribution.
- Vault: Store every image, video, voice note, and Live Mode snap in folders you control. Use that library to feed Video, Live Mode, the Scheduler, and the Agent.
- Photo Control: Direct five dimensions for each shoot: Setting, Outfit, Shot Style, Expression, and Object. Keep likeness locked across every frame.
- Photo Shoot: Turn one image into a coherent set of up to ten related shots.
- Agent: Let the Agent interview you into a finished setup and write directly into the prompt bar and Photo Control panel.
- Reusable Environments, Outfits, and Objects: Reuse elements from each shoot so the next one sets up faster and stays on brand.
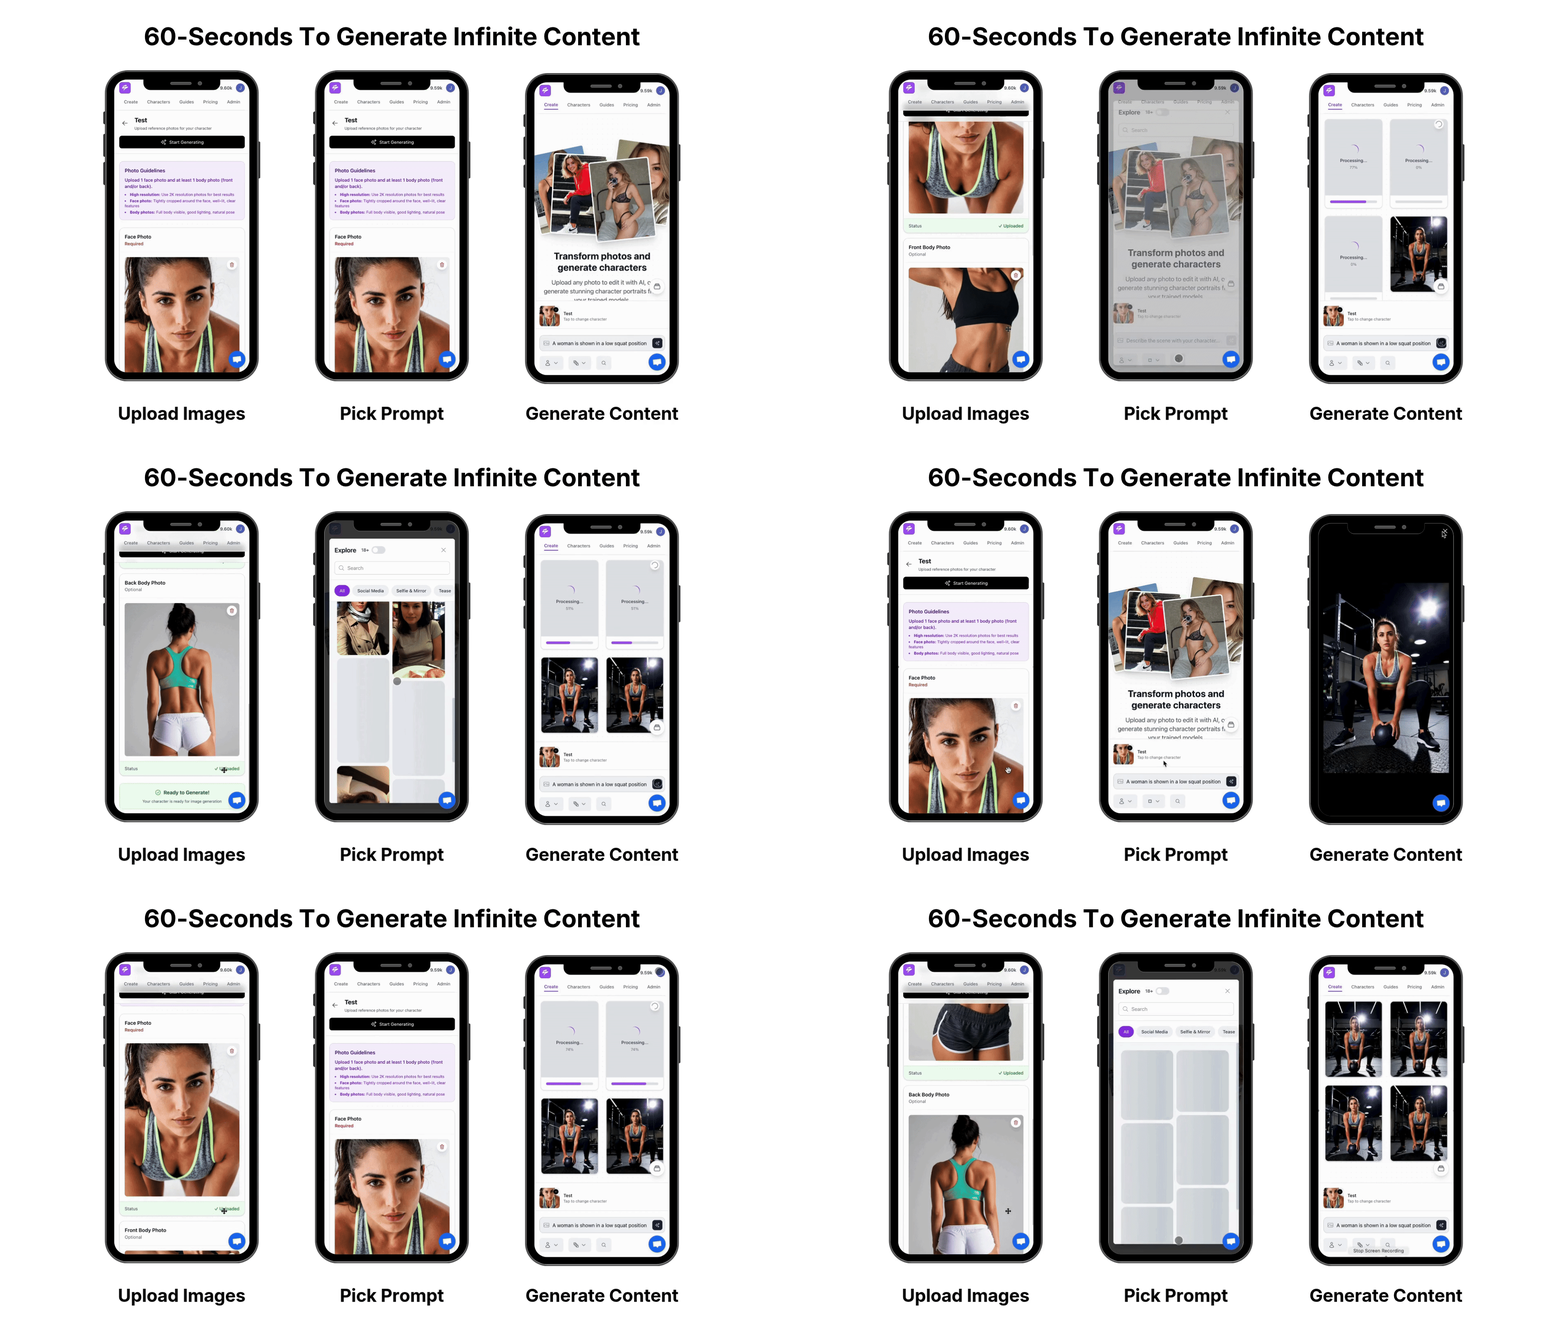
Sozee works as an AI Content Studio for the Creator Economy that closes the loop from measurement to publishing. Creators keep posting consistently because the workflow removes busywork instead of adding more.
Conclusion
The TikTok analytics dashboard gives you a clear decision tool, and your account type shapes what you see. The data has limits such as processing delays, short reporting windows, and no individual viewer identities. Once you know which tab to check and why, the real advantage comes from acting on those insights consistently. Sozee connects measurement, creation, and scheduling so you can turn TikTok analytics into a repeatable content engine.
Turn Your Analytics Into Action