- TikTok offers two export options: a desktop CSV export limited to 60 days of analytics and a mobile full data request that provides a lifetime privacy archive.
- The native CSV export is desktop-only, requires a Creator or Business account, and data that passes the 60-day window cannot be recovered.
- Third-party tools like Sozee store performance data beyond that window and remove the need for recurring manual exports.
- Account bans create short appeal and download windows, as little as 23 days in the US, before data access ends.
- Sozee captures TikTok analytics continuously and supports cross-platform reporting without manual CSV work.
Method 1: The Native Desktop CSV Export
Use this method when you need a quick CSV snapshot of recent performance. The exact menu path is: TikTok.com → Profile Icon → TikTok Studio → Analytics → Export Data. TikTok Studio on desktop includes an Analytics tab with an “Export Data” button in the top-right corner that downloads analytics data as a CSV file covering three categories of metrics:
- Overview: Total video views, profile visits, follower count, and net follower change.
- Content: Per-video performance including views, reach, watch time, shares, comments, and likes.
- Followers: Audience demographics including age, gender, top territories, and most active times.
Critical Pitfall: TikTok’s native analytics dashboard covers a rolling 60-day window for most metrics, and no long-term archive is maintained. This method is desktop-only. If you skip exports and the window advances, that older data disappears from the native dashboard and does not return.
Stop Losing Data to the 60-Day Window
Method 2: The Mobile Full Data Request
Use the mobile “Download your data” feature when you need a full privacy archive of your account. The export is a compliance file, not a simple analytics spreadsheet. TikTok’s mobile data download is a privacy and data-portability export that includes profile details and activity logs and extends beyond the 60-day window, unlike the desktop analytics CSV export which is limited to 60 days of performance data.
The menu path is identical on Android and iOS:
- Go to your Profile.
- Tap the Menu icon (☰) in the top right.
- Tap Settings and privacy.
- Tap Account.
- Tap Download your data.
- Select the data categories you want to include.
- Choose TXT or JSON format.
- Tap Request data.
TikTok may take a few days to prepare the downloadable file, and once ready, the file remains available for download for up to 4 days, after which you must submit a new request. The archive contains profile information, activity logs, comment history, privacy settings, and some analytics data, delivered as a zip file in your chosen format. You can also initiate this request on desktop at TikTok’s official support page for data requests.
Pro Tip: Choose JSON if you plan to parse the data with a tool. Choose TXT if you only need to read it.
Method Comparison: Native CSV vs. Full Data Request
The two native options differ in where they run, what format they produce, and how far back the data goes. The table below summarizes those differences so you can match each method to your reporting or compliance needs.
| Method | Where | Format | Data Window | Best For |
|---|---|---|---|---|
| Native CSV Export | Desktop (TikTok Studio) | CSV | 60 days | Quick performance reports and client updates. |
| Full Data Request | Mobile App or Desktop Settings | JSON / TXT | Account lifetime | A complete personal data archive for compliance. |
Why the Export Button Is Missing or Fails
Several distinct conditions can cause the export button to disappear or the download to fail.
- Account Type: The analytics CSV export generally requires a Creator or Business account, though some sources dispute whether personal accounts are fully locked out. If you switch account types to gain access, TikTok only starts tracking from the moment of the switch, so you do not gain retroactive history.
- Device: The CSV export button is only available on the desktop version of TikTok Studio; the mobile app does not offer CSV export. You cannot export the analytics CSV from the mobile app on Android or iOS.
- Initialization Delay: After switching to a Creator or Business Account, TikTok takes 24 to 48 hours to initialize analytics tracking, so a recently switched account may show no data during that period.
- The 60-Day Window: Because TikTok’s native analytics only retain a rolling 60-day window, users cannot compare the current quarter to the same quarter last year, since the older data was never stored.
- Server Load: TikTok documents three primary reasons a report download can fail: the selected data set is too large, the server is busy, or too many reports are being downloaded simultaneously.
- Browser or Extension Issues: TikTok recommends several browser-side fixes. Disable content-blocking extensions such as AdBlock. Try Google Chrome in Incognito mode. Switch to another browser such as Firefox or Safari. If those steps fail, restart your computer or try a different one.
If the dashboard appears blank but your account type is correct, clearing browser cache and reloading TikTok Studio resolves display issues in roughly half of reported cases.
Native Export vs. Third-Party TikTok Analytics Tools
The native CSV export has three structural limitations. It requires manual effort on a recurring schedule. It caps out at 60 days of account-level history. It also provides no cross-platform view. TikTok’s native analytics lacks a long-term archive, so comparing performance beyond that window requires exporting data or using a third-party tool that records it daily.
Third-party tools address these gaps by pulling data through TikTok’s API and storing it continuously. Third-party TikTok analytics tools like Later preserve only the data they capture after an account is connected; they cannot backfill historical data that was never captured before TikTok’s native window elapsed. Connecting a tool early protects more of your history.
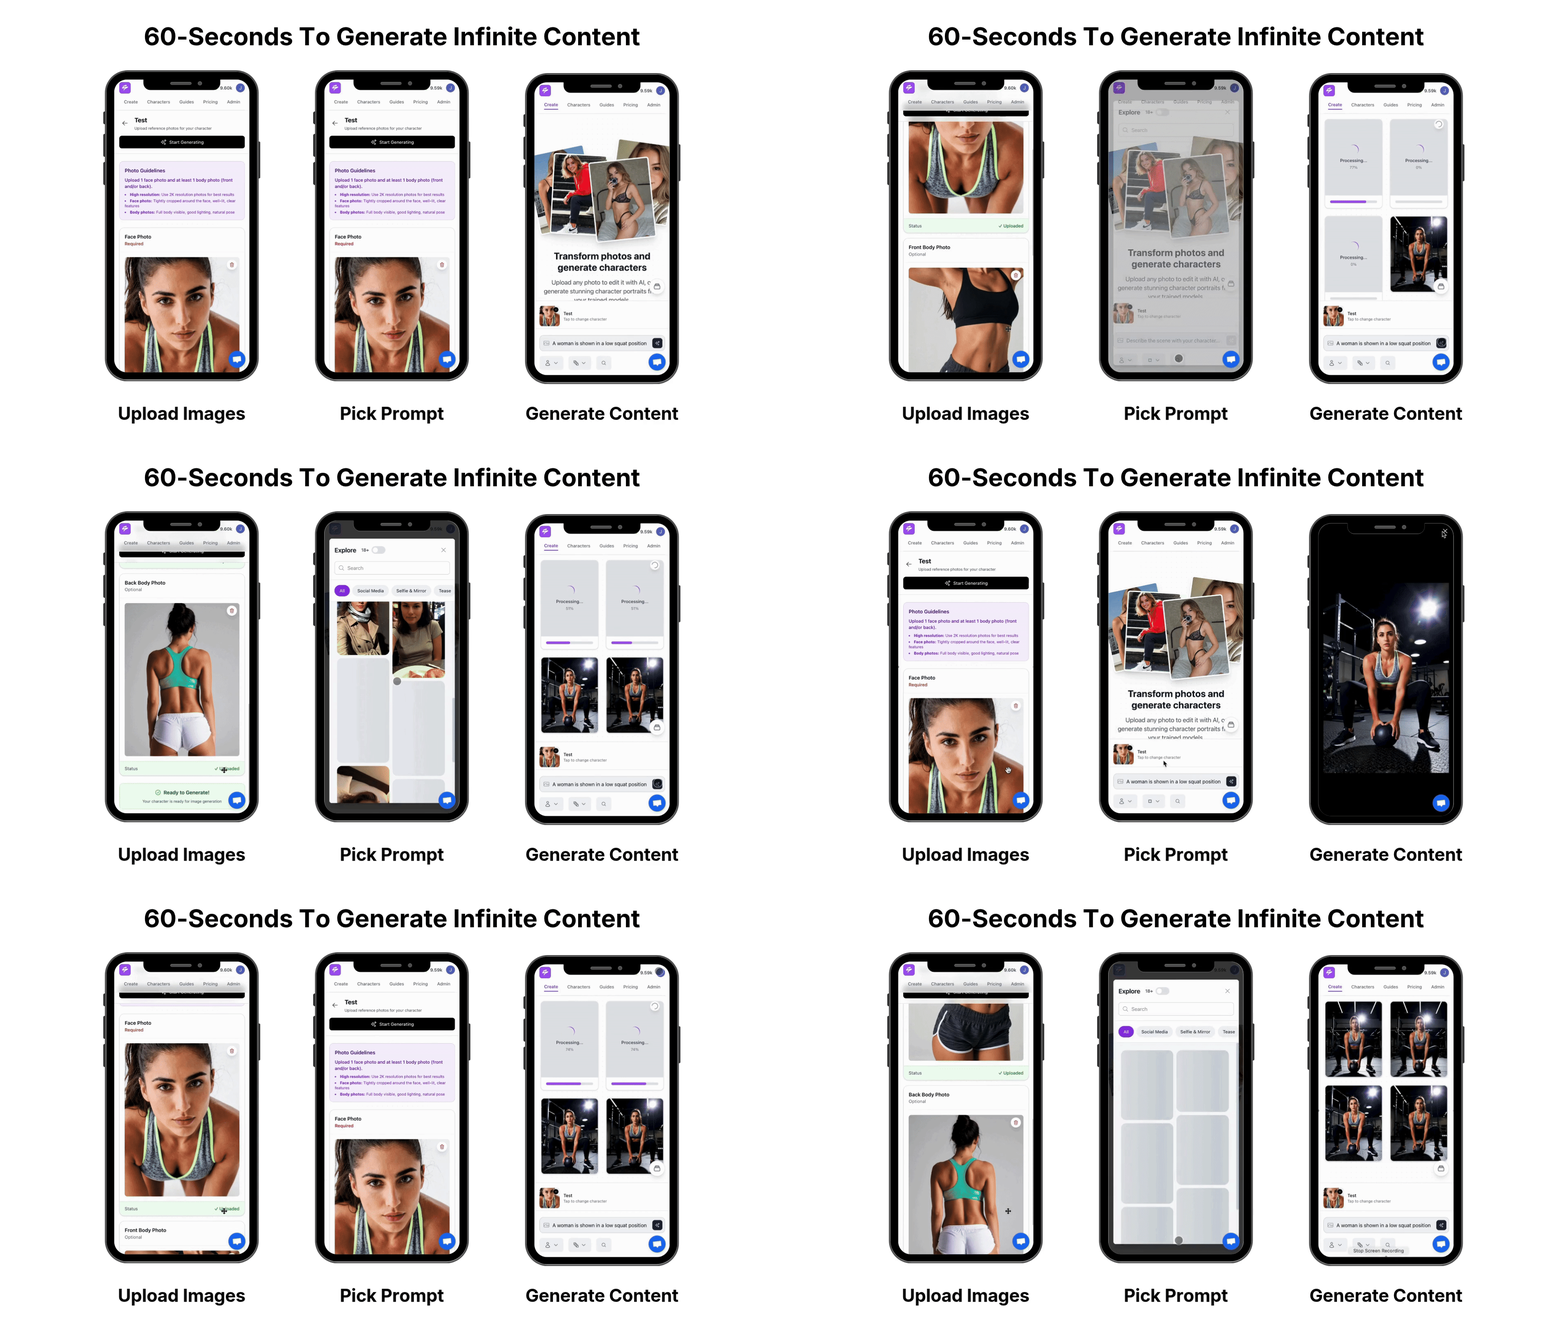
Sozee’s Analytics dashboard reports impressions, reach, likes, comments, shares, and engagement. It also provides a split between what Sozee posted and what you posted, so creators and agencies see continuous TikTok performance data without manual CSV exports or constant worry about data aging out. The Scheduler connects Instagram, TikTok, X, Facebook, Reddit, and Fanvue on a per-character basis. That setup keeps your entire publishing and measurement workflow in one place.
Capture Your TikTok Analytics Automatically
Download TikTok Data After a Ban: Preserving Your Analytics
When an account is banned, the user receives a banner notification on login and can still log in during the notice period to submit an appeal and to download their data. Acting immediately protects more of your history.
Critical Pitfall: For underage bans, TikTok publishes a hard window to appeal and retrieve data: 113 days in most of the world, 180 days in the European Economic Area, the UK, or Switzerland, and just 23 days in the US. After that window closes, the data download tool stops working and the data remains unavailable.
Follower counts and historical engagement on a banned or deleted account are not recoverable; a new account starts at zero. TikTok’s public documentation describes no way to import a downloaded data file into another TikTok account, and no official bulk-import or account-merging feature is documented. A downloaded archive is an export of selected account information, not a restore path.
This reality makes continuous, automated data preservation valuable. A tool that snapshots your analytics daily keeps your performance history outside TikTok’s systems, so bans, deletions, and rolling data windows do not erase it.
Assuming you have a CSV in hand, the next step is making it presentable. The workflow below turns that raw export into a client-ready report.
Turning Your CSV Into a Client-Ready Report
Start by opening the CSV file in a spreadsheet application and building a simple summary. Use pivot tables to aggregate and sort the data. Focus your analysis on a few core metrics.
- Follower growth trends over the export period.
- Post-by-post performance such as views, average watch time, shares, and completion rate per video.
- Engagement rate calculated by dividing total interactions by views or followers, depending on the reporting standard your client expects. TikTok does not calculate an engagement rate for users; creators must compute it themselves, and the result changes dramatically depending on whether total interactions are divided by followers or by views.
Present clients with a clear narrative. Highlight which content formats drove the most watch time. Call out posts that underperformed and explain likely reasons. Close with specific recommendations for the next period. TikTok’s native desktop analytics exports are snapshots, so users who skip regular downloads create gaps that later analysis cannot fill. A single missed export cycle can leave a permanent hole in a client’s performance record.
Sozee’s Analytics dashboard automates this reporting workflow. It provides a continuously updated view of performance across all connected platforms. The split between Sozee-scheduled posts and manually published content gives agencies clear evidence of what the tool contributes, creating a client-ready data layer that requires no spreadsheet work.
Build Client Reports Without Spreadsheets
Below are answers to the most common questions about exporting and preserving TikTok analytics data.
Frequently Asked Questions
How Do I Export My TikTok Data?
You can export your TikTok data in two ways. For analytics, use the “Export Data” button in TikTok Studio on a desktop computer. This produces a CSV file covering up to 60 days of performance metrics including views, follower growth, and per-video data. For a full account archive, use the “Download your data” feature in the mobile app or desktop settings, which generates a ZIP file in JSON or TXT format containing your profile information, activity history, comment history, and privacy settings. The two features are separate and serve different purposes. The CSV supports performance reporting, and the archive supports privacy compliance and personal backup.
Why Can’t I Download My TikTok Data?
The most common reasons are account type, device, and data age. The analytics CSV export generally requires a Creator or Business account, though some sources dispute whether personal accounts are fully excluded. The CSV export is also desktop-only; attempting it from the mobile app will not work. If you are trying to access data older than the current window, it is no longer available through the native export because TikTok does not retain account-level analytics beyond that rolling period. Additional causes include browser extensions blocking the download button, a server-side load issue on TikTok’s end, or an account that was recently switched to a Creator or Business type and has not yet completed the 24–48 hour initialization period. Try clearing your browser cache, switching to a different browser, or disabling ad-blocking extensions.
How Do I Pull TikTok Analytics?
To pull TikTok analytics natively, go to TikTok.com on a desktop, click your profile icon, select TikTok Studio, click “Analytics” in the left sidebar, set your date range, and click “Export Data” to download a CSV. For ongoing analytics without manual exports, connect your TikTok account to a third-party tool like Sozee, which continuously snapshots your performance data and stores it beyond the native window. Third-party tools require account authorization through TikTok’s API permissions, so you should never share your login credentials with a third-party service.
Connect Your TikTok Account to Sozee
How Do I Export TikTok Analytics on Android?
You cannot export the analytics CSV directly from the Android app. The CSV export is only available through TikTok Studio on a desktop browser. However, you can request a full data download from the Android app by navigating to Profile → Menu (☰) → Settings and privacy → Account → Download your data. This produces a privacy archive in JSON or TXT format, not a structured analytics CSV. For recurring analytics reporting from a mobile-first workflow, a third-party tool connected to your TikTok account is the practical solution.
Is Exporting TikTok Analytics Data Free?
Yes, both the native desktop CSV export and the mobile full data request are free features provided by TikTok; the CSV export is available to Creator and Business account holders, while the mobile data request is a standard privacy feature available to all users. The CSV export requires no paid subscription and is available immediately in TikTok Studio. The full data request is also free and is a standard privacy right available to all TikTok users. Third-party analytics tools that extend history, automate data collection, or provide cross-platform reporting typically charge a monthly subscription fee.
What Do I Do If My TikTok Account Is Banned?
Log in immediately during the notice period to submit an appeal and download your data. The data download window is time-limited and varies by ban type and region, and in the US that window is even shorter. After the deadline passes, the data download tool becomes inaccessible and the data remains unavailable. Follower counts and historical engagement cannot be transferred to a new account; any new account starts from zero. For a durable solution, use a tool like Sozee to preserve your analytics data outside of TikTok’s systems, so a ban or deletion does not erase your performance history.
Protect Your Analytics Before the Window Closes
Conclusion
Manual TikTok exports create a fragile, time-consuming workflow with a hard expiration date. The rolling window means every week without an export is a week of data that moves closer to permanent loss. The export button can disappear without warning for the wrong account type or device. When an account is banned, the window to retrieve anything can be as short as the 23 days mentioned earlier.
Sozee removes these failure points. Its Analytics dashboard continuously captures impressions, reach, likes, comments, shares, and engagement across TikTok and every other connected platform, with a clear split between Sozee-scheduled posts and manually published content. You no longer have to run manual exports, race a cutoff, or scramble to assemble data before a client report is due.
Start Preserving Your TikTok Analytics with Sozee
Read Next
- Instagram Insights and Meta Business Suite are free native tools that provide 90 days of data for Business and Creator accounts.
- Metricool, Buffer, and Iconosquare offer permanent free tiers with limits on brands, accounts, and data history.
- Free tools keep a short data window and cannot access competitor private metrics such as reach or saves.
- Native tools work well for single-account creators, while third-party options add scheduling and competitor tracking within their limits.
- Sozee connects analytics directly to content production so creators can act on insights without switching tools.
Start Creating With Sozee Today
Which Instagram Analytics Tools Have A Free Tier?
Several tools offer a genuine free tier for Instagram analytics in 2026. Each has firm limits on accounts, history, and features.
- Instagram Insights — free for every Business and Creator account; 90-day rolling history, own account only.
- Meta Business Suite — free desktop companion to Insights; aggregate data up to roughly 2 years, per-post data tied to post date.
- Metricool — permanent free tier; 1 brand, 30 days of history, 5 competitor profiles, 20 scheduled posts per month.
- Buffer — free forever tier; 3 channels, 30-day Insights history, 10 scheduled posts per channel at any one time.
- Iconosquare — permanent free plan; 2 profiles, 1 month of history, 10 scheduled posts per month per profile.
- Not Just Analytics — limited free access; paid plans start at €109.80/year for 1 profile and 1 month of business data.
- SocialStats.info — free public-profile tracker; unlimited public Instagram accounts, weekly email reports, PDF downloads.
Free Instagram Analytics Tools Compared
The table below lines up free-tier limits, data retention, and ideal users for each tool so you can see where each ceiling sits.
Native Tools: Instagram Insights And Meta Business Suite
Every Instagram Business or Creator account gets Instagram Insights for free, inside the app or at business.facebook.com via Meta Business Suite. The free data set covers reach, Views, interactions, follower demographics, per-post and per-Reel breakdowns with retention graphs, Story metrics, and follower-attribution showing which post brought each new follower.
Instagram Insights retains account-level data for a rolling 90-day window, and follower growth charts only go back 30 days. Anything older disappears unless exported. Story metrics disappear after 14 days if not captured. Meta Business Suite extends aggregate history to roughly two years, while per-post data still ties to the original post date.
Native tools work well when you manage one account, post from the app, and accept the short history window mentioned earlier. They fall short once you need competitor data, cross-platform reporting, scheduled posts with analytics, or trend analysis across longer periods.
The Best Third-Party Free Tools
Third-party tools step in where native tools stop, adding competitor tracking, cross-platform views, and scheduling on top of Instagram’s data.
Metricool
Metricool’s free tier is permanent and covers 1 brand, 30 days of analytics history, 5 competitor profiles, and 20 scheduled posts per month. The paywall appears when you add a second brand, need more competitor slots, want longer history, or require API access and advanced multi-brand management. Metricool also includes best-time-to-post heatmaps and clean exportable reports on the free tier, so it suits creators who want basic competitor tracking without paying.
Buffer
Buffer’s free forever plan connects up to 3 channels with 10 scheduled posts per channel and 30 days of analytics history. Date range options on the free tier stay limited to Last 7 days, Last 30 days, and Month to date; custom ranges and exports require a paid plan. Buffer has no social listening or competitor tracking on any plan, and the paywall appears at a fourth channel, unlimited scheduling, or deeper analytics.
Iconosquare
Iconosquare’s permanent free plan covers 2 social profiles, 1 user, 10 scheduled posts per month per profile, and 1 month of analytics history. AI tools, custom dashboards, and competitor monitoring stay locked behind paid tiers, and competitor benchmarking unlocks only on the Scale plan. The paywall appears at a third profile, more than 10 posts per month, or any need for history beyond one month.
Not Just Analytics And SocialStats.info
Not Just Analytics offers limited free access, with paid plans starting at €109.80/year for 1 profile and up to 1 month of business data. It suits creators who want AI-assisted interpretation of their own profile data rather than raw metric exports.
SocialStats.info is a free public-profile tracker that lets users monitor unlimited public Instagram accounts, receive weekly email reports, and download PDF analytics. It stays limited to publicly visible data such as engagement rates, top hashtags, top mentions, and follower stats, and it cannot see private account data.
Connect Your Analytics To Your Content Workflow
Best Free Instagram Analytics For Competitors
Instagram launched its native Competitive Insights feature in November 2025 inside the Professional Dashboard, letting Business and Creator accounts track up to 10 public professional accounts across 30, 60, or 90-day windows. It shows follower growth trends, posting frequency by format, and basic post-level likes and comments, but omits engagement rates, saves, shares, reach, and impressions.
Among third-party free tools, Metricool’s free tier allows tracking up to 5 competitor profiles. SocialStats.info tracks unlimited public accounts for follower stats and engagement rates. igtrackr’s free Profile Analyzer returns engagement rate versus niche benchmark, posting cadence, and top posts for any public handle without an Instagram login.
Free tools can legitimately show competitor follower counts, following counts, posting frequency, content mix, and engagement calculated from public likes and comments. No third-party tool can access a competitor’s private Instagram metrics such as reach, impressions, saves, or Story data, because Meta’s API never exposes those numbers for accounts you do not own.
Can ChatGPT Analyze My Instagram?
ChatGPT cannot pull Instagram data on its own. ChatGPT works as an analysis layer rather than a native Instagram data source: it calculates engagement rates, identifies content patterns, and suggests strategy from data the user supplies by exporting metrics from Instagram Insights or Meta Business Suite and pasting or uploading CSVs or screenshots into the chat.
On ChatGPT Pro, Team, Enterprise, and Edu plans, a remote MCP connector can pull live data from Meta Graph directly, while ChatGPT Free and Plus do not support MCP connectors. Even with a connector, every MCP connector can only reach Instagram Business and Creator accounts, and personal accounts stay locked out.
ChatGPT also cannot analyze competitor private analytics, perform sentiment analysis at scale across thousands of comments, or remember prior conversations without the user re-supplying the data.
What Free Instagram Analytics Tools Cannot Do
A persistent myth claims that analytics tools reveal who viewed your profile, who “stalks” your account, or a ranked list of frequent visitors. Instagram never exposes profile visitors, and no legitimate tool can show the posts, Stories, or follow lists of a private account. Tools that promise profile-viewer lists rely on fabricated data or risky credential collection.
Beyond privacy myths, free tools share a structural ceiling.
- Short data history makes year-over-year comparison difficult without a paid tool or a disciplined export habit.
- Competitor data stays limited to public metrics such as followers, posting frequency, and engagement from visible likes and comments, while reach, saves, and Story metrics for other accounts never appear.
- No free third-party tool connects analytics to the content you actually produce and publish, so measurement ends at the number and leaves the next post disconnected.
What Is The 5-3-1 Rule On Instagram?
Neither version comes from Instagram or Meta. Both are community-created frameworks that keep an account from becoming pure promotion. Analytics shows whether the mix works in practice, so if educational posts generate the most saves and sales posts generate the least engagement, the data signals a ratio change before the audience burns out.
Native Vs. Third-Party: Choosing What You Actually Need
Native Instagram Insights and Meta Business Suite work best when you manage one account, post directly from the app, and accept the 90-day history window. The data comes straight from Meta, covers the full metric set including reach and follower demographics, and stays free.
A third-party tool becomes useful when you need competitor tracking beyond Instagram’s 10-account Competitive Insights feature, cross-platform reporting across Instagram, TikTok, and other networks in one view, scheduled posts with analytics attached, or longer history for trend analysis and year-over-year comparisons.
Free third-party tools usually cap history at about a month, focus on one brand or account, and separate analytics from the content you create. They measure what happened and leave the creative response to you.
See What Sozee Adds Beyond The Free Tier
Where Sozee Fits: Analytics Tied To Content Production
Sozee closes the loop between what the numbers say and what gets published next.
Sozee’s Scheduler connects Instagram, TikTok, X, Facebook, Reddit, and Fanvue, and it manages each platform per character rather than per account. It supports photos, carousels, Reels, and Stories, and shows a live preview of the real post before it goes out. Analytics inside Sozee tracks impressions, reach, likes, comments, shares, and engagement, with a clear split between what Sozee posted and what you posted manually.
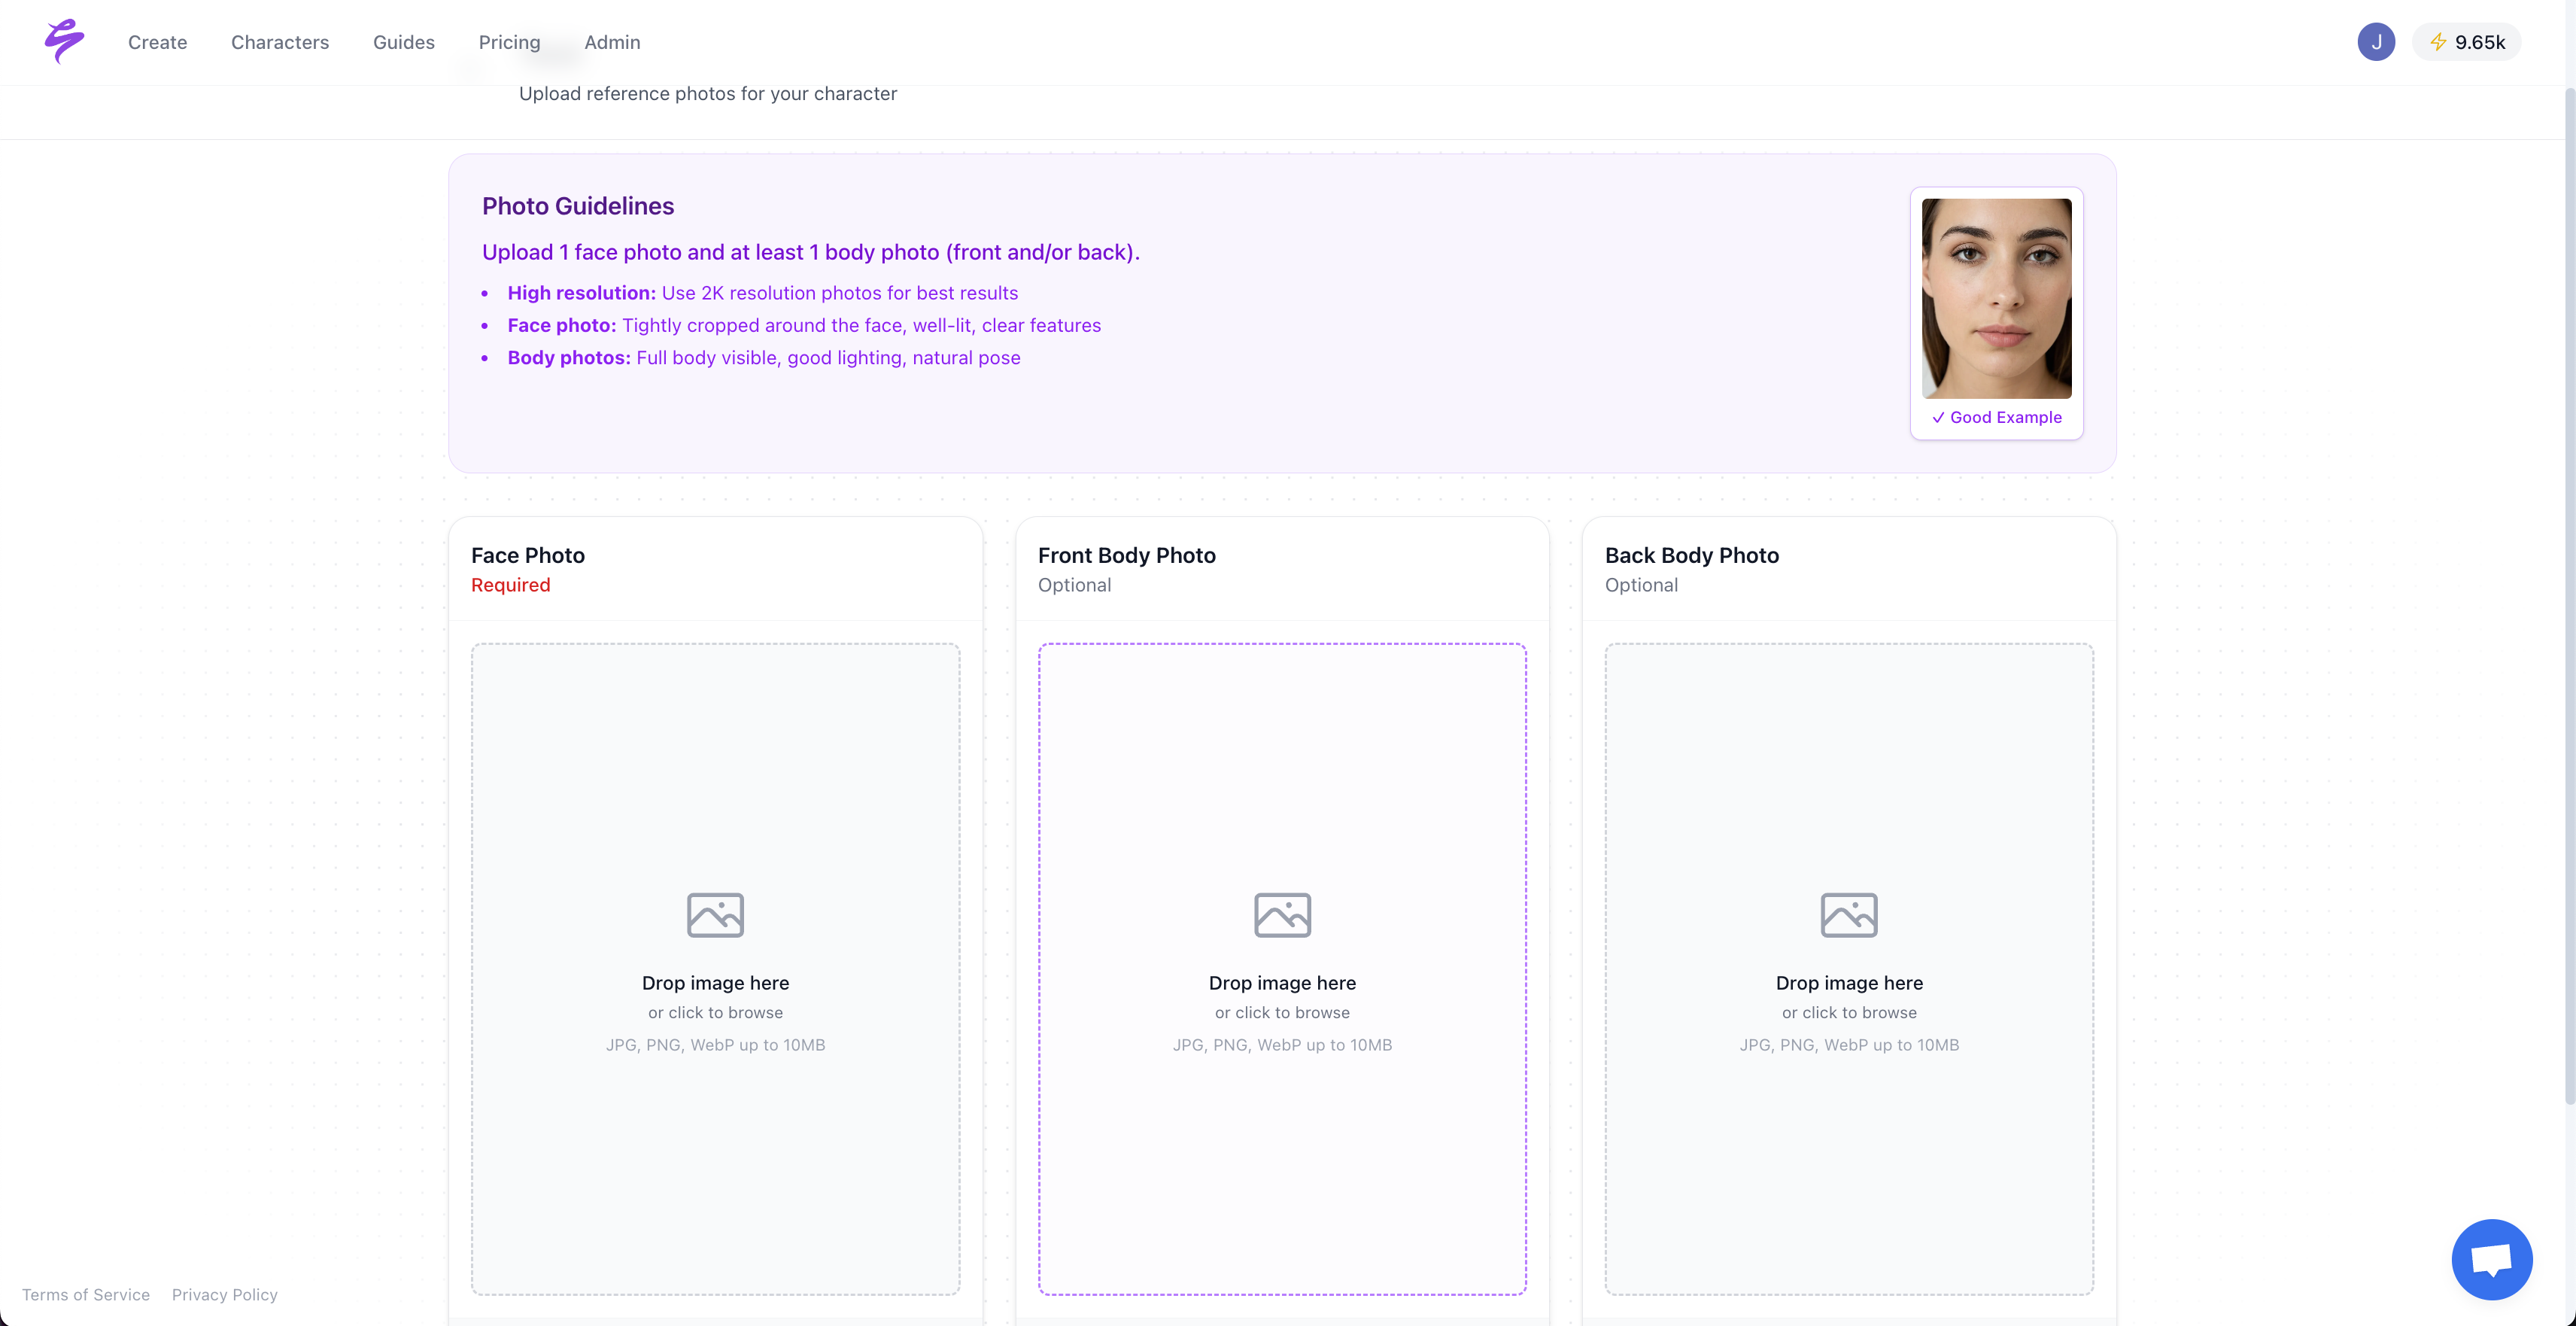
The workflow starts before the post. You cast a character from three photos or build one from scratch with the AI Character Builder. From there, Photo Control defines a shoot across five dimensions: Setting, Outfit, Shot Style, Expression, and Object. Photo Shoot then turns one image into a coherent locked set of up to ten, and inpainting or Reimagine refine any shot that needs work. You schedule directly from the Vault, while the Agent handles the setup interview and writes the caption. For agencies, Teams and workspaces run every client from one login with fully isolated characters, vaults, and connected accounts.
Free analytics tools tell you a Reel performed well. Sozee lets you shoot the next one in the same setting, with the same character and outfit, and schedule it before the momentum fades, all in one place.
Frequently Asked Questions
Is There A Free Tool For Instagram Analytics?
Yes. Instagram Insights is free for every Business and Creator account and covers reach, engagement, follower demographics, and per-post breakdowns with up to 90 days of history. Meta Business Suite extends aggregate history to roughly two years at no cost. Among third-party tools, Metricool, Buffer, Iconosquare, Not Just Analytics, and SocialStats.info each offer a free tier with limits on profiles, history, or features, so the right choice depends on whether you value competitor tracking, scheduling, or public-profile monitoring most.
Can ChatGPT Analyze My Instagram?
ChatGPT cannot connect to Instagram or pull your account data directly. It can analyze data you export from Instagram Insights or Meta Business Suite and paste or upload into the chat, calculating engagement rates, spotting content patterns, and suggesting strategy from the numbers you provide. On paid ChatGPT plans (Pro, Team, Enterprise, Edu), a remote MCP connector can pull live data from Meta’s Graph API for Business and Creator accounts you own, while personal accounts remain excluded.
What Is The 5-3-1 Rule On Instagram?
The 5-3-1 rule refers to two community-created frameworks rather than an official Instagram feature. The engagement version encourages a daily habit of five likes, three genuine comments, and one follow within your target audience. The content-mix version structures a cycle of nine posts, with five educational or entertaining posts, three connection-building posts, and one sales post, and analytics helps confirm whether that mix keeps your audience engaged.
What Can’t Free Instagram Analytics Tools Do?
Free Instagram analytics tools cannot show profile viewers or “secret admirers,” cannot access private competitor metrics such as reach, saves, or Story data, and rarely store enough history for deep trend analysis. They also stop at measurement and do not help you turn insights into the next piece of content, which is where many creators struggle to grow.
Conclusion: Measure Less, Make More
Free Instagram analytics tools provide real value within their limits. Instagram Insights and Meta Business Suite cover the fundamentals for any single-account creator at no cost. Metricool adds competitor tracking on a permanent free tier, and Buffer and Iconosquare add scheduling with basic analytics.
The real gap is a production gap. Knowing which Reel performed best only helps if you can recreate that success quickly with the same character, in the same world, and get it scheduled before the insight goes stale. Sozee exists for that gap, giving you a studio where analytics connect directly to the content driving them, in one place, without juggling multiple tools just to run your account.
Read Next
- TikTok analytics metrics are quantitative signals that reveal what happened with a video. The diagnostic work is interpreting why.
- Creators can use a four-question framework – Did People See It, Did They Watch It, Did They Care, Did They Act – to turn raw numbers into clear next steps.
- Account-level, video-level, and engagement metrics work best together. A high view count with low completion rate tells a different story than the same views with high completion.
- Shares and saves carry more algorithmic weight than likes, so creators should prioritize content that feels useful or surprising enough to pass on.
- Sozee helps creators act on these insights by turning diagnostic takeaways into consistent, high-retention content at scale.
Why TikTok Analytics Feel Opaque And How To Read Them
The dashboard shows numbers but not meaning. Vendor glossaries define terms but rarely help diagnose a video. Many creators end up guessing whether to delete, repost, or change strategy entirely, and the guess is usually wrong.
A simple diagnostic framework makes TikTok analytics usable. The goal is making decisions, not memorizing definitions. Four questions organize everything:
- Did People See It? (account-level reach)
- Did They Watch It? (video-level retention)
- Did They Care? (engagement signals)
- Did They Act? (growth conversion)
Creators who skip this framework keep making content blind. They burn out and leave growth on the table. Every metric below maps to one of these four questions.
How To Interpret TikTok Analytics: The Three Metric Buckets
TikTok Studio organizes data into three primary buckets: account-level overview metrics, video-level content metrics, and engagement and growth metrics. Reading metrics together matters more than reading them in isolation. A high view count paired with a low completion rate tells a completely different story than the same view count paired with a high completion rate.
Before diving into each bucket, it helps to see how the four questions map onto them. See lives in account-level metrics. Watch lives in video-level metrics. Engage and Act live in engagement and growth metrics.
TikTok’s official support documentation and TikTok’s Creator Academy are the primary sources for metric definitions. Creator Search Insights, accessed by typing its name into the TikTok search bar, surfaces frequently searched topics and a content-gap filter showing what gets searched often but is not covered by many videos. Most creators ignore this free keyword intelligence.
TikTok Analytics Free Vs. Paid Tools
TikTok Studio’s native dashboard is free and covers views, watch time, completion rate, traffic sources, follower demographics, and active hours across 7, 28, or 60-day windows. Third-party TikTok analytics trackers add competitor benchmarking, cross-platform reporting, and longer data history, but no tool can exceed what TikTok’s API exposes. Buffer states in its own documentation that advanced TikTok analytics are unavailable in its product due to TikTok API limitations. The native dashboard is the right starting point for most creators. Third-party tools add value once the native data is being read consistently.
Where To Find TikTok Analytics On Mobile And Desktop
You need to reach the analytics dashboard before you can diagnose anything. On mobile, tap your profile icon, open the menu (☰), select TikTok Studio, then tap Analytics. On desktop, go to tiktok.com/tiktokstudio, sign in, and click Analytics in the left menu. The desktop version shows more decimal points and allows CSV export, while the mobile app does not.
Analytics require at least a free Creator or Business account. Personal accounts must switch via Settings and Privacy → Account. The lookback window is capped at 60 days, with 7-day and 28-day options also available. Export or screenshot data you want to keep beyond that window.
Account-Level Metrics: Video Views, Profile Views, Unique Viewers, Follower Count
Video Views are the total times your videos were played. TikTok counts a view the moment a video starts playing, which can be well under one second. That means a high view count can hide passive consumption. If views are high but profile views are flat, viewers are watching without feeling curious about you. Add a reason to click your profile.
Profile Views measure how many people visited your profile page. If profile views are high but follower count is flat, your bio or pinned videos are not converting. Fix the profile before you focus on new content.
Unique Viewers are the individual accounts that watched. TikTok One defines unique viewers as the number of unique viewers who watched a video or at least one video in a project. If unique viewers are far below video views, the same people are rewatching and you are not reaching new audience.
Follower Count is total followers plus net gains or losses. If follower count is the only metric you check, you are reading the least diagnostic number on the dashboard. TikTok is a discovery platform where videos are shown to non-followers, meaning a 3,000-follower account can out-reach a 300,000-follower account in any given week.
Video-Level Metrics: Average Watch Time, Watched Full Video, Retention, Traffic Sources, Reached Audience
This bucket is the diagnostic core. These metrics reveal hook and pacing problems before anything else does.
Average Watch Time is the average duration people spend watching your video. TikTok One calls this “Average view time” and defines it as total play time divided by the number of views. If this is low, your hook is failing in the first one to two seconds. Open on the payoff, not the setup. The average watch time across all TikTok content is approximately 8.4 seconds, which means the hook must land immediately.
Watched Full Video is the percentage of viewers who watch to the end, commonly called completion rate. TikTok One documents the formula as complete video views divided by total video views. If this is low, your video is too long for its payoff. Cut runtime or move the payoff earlier. You can calculate average percentage watched yourself: watch time ÷ video length × 100.
Retention shows where viewers drop off across the video. The biggest retention drop across all short-form content occurs in the first three seconds. In that window, 40–70% of the potential audience decides to leave. If there is a cliff in the first three seconds, the hook failed. If there is a cliff at a specific moment, that transition or tangent is the problem.
Traffic Sources show where viewers found your video, such as For You, profile, search, sound page, or other. For most creators, the overwhelming majority of views come from the For You Page. A video drawing heavy FYP traffic is performing well algorithmically. An unusually high proportion of Search traffic signals lasting discoverability. If most views come from your profile rather than the For You feed, the video did not earn distribution. Examine the hook and retention curve.
Reached Audience is the number of unique users who saw your video at least once. If reached audience is high but engagement is low, the content reached people who were not the right audience. Check your topic signals.
Engagement Metrics: Likes, Comments, Shares, Saves, Engagement Rate
Shares and saves matter more than likes for distribution. The metrics below explain why.
Likes are the number of times users tap the heart. 67% of marketers track likes as their primary TikTok metric despite likes being the weakest predictor of actual business outcomes. If likes are your primary metric, you are tracking the weakest predictor of reach.
Comments are text reactions left by viewers. If comments are low but views are high, add a question or a hot take. Comments signal active attention.
Shares are the number of times users send your video to others. Viral TikTok videos typically achieve a share-to-view ratio of 1–3%. If shares are low, your content is not useful or surprising enough to pass on. Build for utility or a clear payoff.
Saves (Favorites) are the number of times users bookmark your video. TikTok’s current first-party reporting term for saves is “Favorites.” If saves are high, make more tutorials, lists, and reference-style posts.
Engagement Rate is the percentage of viewers who interact. TikTok One’s documented formula is (Likes + Comments + Shares) ÷ Video views × 100. TikTok does not calculate this for you. Compute it yourself, and always write down the denominator you used. A platform-wide average engagement rate of 4.90% was recorded in the first half of 2025. Accounts under 100,000 followers averaged 7.50%.
Create Content That Gets Shared
Growth Metrics: Profile Views And Followers Gained
Growth metrics act like conversion rates. They show whether content builds an audience or just entertains.
Profile Views measure how many people visited your profile after watching. If views are high and profile views are low, your content is entertaining but not about you. Add a recurring personal element or signature format.
Followers Gained is net new followers over the period. TikTok Studio reports “Net followers” in its account analytics, equal to new followers minus lost followers. If followers gained is low relative to views, your content is not converting curiosity into audience. Check the profile, the bio, and whether the video promised something the account delivers.
How To Read TikTok Analytics Metrics Together: A Worked Example
Consider two videos. Video A has 100,000 views and a 25% completion rate. Video B has 30,000 views and a 70% completion rate with strong shares.
The math: 100,000 × 25% = 25,000 full watches. 30,000 × 70% = 21,000 full watches. The raw numbers look close, but Video B’s shares and saves tell the algorithm the content was worth passing on. TikTok’s algorithm weights shares and saves more heavily than likes, because a save signals that content is valuable enough to return to. Video B keeps getting tested with new audiences while Video A flatlines.
The smaller video is the bigger win for distribution and audience building. Read metrics together, not in isolation. Always write the denominator beside every rate. Use labels like “engagement rate by views” rather than just “engagement rate,” because a changed denominator can make it look like performance changed when only the base did.
Troubleshooting: Diagnosing 200 View Jail And Other Common Issues
Why Am I In 200 View Jail? The “200-view jail” is creator shorthand, not an official TikTok feature. TikTok tests every video with a small initial audience. A plateau in the low hundreds means that test cohort scrolled past, usually because of a weak hook in the first one to three seconds. Treat this as feedback, not punishment.
Is 500 Views In 1 Hour Good On TikTok? The answer depends on your account size and your completion rate. Every TikTok video starts with a small initial test audience, with estimates ranging roughly from 100 to 1,000 users depending on the source and account. For a small account, 500 views in an hour can be a positive signal. TikTok’s initial test batch for smaller accounts is typically only 100–500 viewers, so the raw view count alone does not prove the video cleared the test. Completion rate and engagement within that first batch determine whether TikTok continues distributing it. Check average watch time before you celebrate or panic.
Should You Delete A TikTok With 0 Views? Usually no. A video at 0 views is typically still in review, on a brand-new account in cold start, or individually flagged. Wait up to 24 hours. Deleting and re-uploading the same file reads as duplicate content and makes the second copy more suspicious.
Are TikTok Analytics Accurate? They are directionally accurate but not real-time. The dashboard processes data in batches and can lag a few hours behind the public view count, and some views are filtered out before being counted, such as views that appear to be bot-generated. Treat the numbers as trends rather than exact scores.
Why Do I Only Get 20 Views? Twenty views usually means the video never cleared the initial test batch. A TikTok account that has lost For You eligibility typically shows a collapse to 20–100 views across consecutive recent videos. This pattern points to a hook problem, a topic-signal problem, or a brand-new account still calibrating. Fix the first two seconds before you change anything else.
Conclusion: Every Metric Ends With A Decision
TikTok analytics metrics are a diagnostic tool, not a scoreboard. Every number answers one of four questions: did people see it, did they watch it, did they care, did they act. Every answer ends with a decision. Low average watch time means fix the hook. Low completion rate means cut runtime or move the payoff. As the engagement metrics showed, shares and saves drive distribution, so low shares mean you should build for utility. Low followers gained means fix the profile.
Knowing what to fix is only half the equation. The other half is producing the consistent, high-retention content that the metrics reward while avoiding burnout from shooting every day. Sozee is built for exactly that moment. Lock your likeness, build your world once, and generate a month of content in an afternoon. The analytics tell you what to make. Sozee makes it possible to make it at scale.
Start Creating High-Retention Content
Read Next
- Content creator analytics matters when a metric change tells you exactly what to publish next.
- Growth comes from retention and completion rate. Sponsorship value depends on consistent reach and stable engagement. Revenue is best measured by revenue-per-view and conversion.
- Native dashboards are the only source of truth for retention, watch time, and revenue.
- Diagnose in chronological order. When a metric moves, identify the first change, then apply the matching next action from the diagnostic framework.
- Sozee is the only platform that closes the loop from analytics to production. Turn your metrics into your next shoot with Sozee.
Match Your Metrics To Your Goal
Analytics only helps when you match the metric to your actual goal. Reading the wrong numbers creates confident decisions that move in the wrong direction.
If Your Goal Is Growth
The signals that predict continued algorithmic distribution are retention and watch time on YouTube, average watch time and completion rate on TikTok, and saves and shares on Instagram. Average view duration is YouTube's strongest signal of content quality. Consistent 60% completion prompts wider distribution. Viewers dropping off at 15% suppresses the video.
On TikTok, completion rate is the heaviest ranking factor in 2026, with saves and shares carrying more weight than likes. On Instagram, watch time, sends per reach, and likes per reach are the signals Instagram weights most heavily for Reels distribution.
If Your Goal Is Sponsorship Deals
Brands buy predictable delivery. A single viral spike does not make a creator a reliable sponsorship partner. The metrics that matter are audience demographics, reach consistency across posts, and engagement rate stability.
TikTok leads on engagement rate at 4.25%, followed by Instagram at 0.98%, Facebook at 0.15%, and X at 0.10%, though YouTube's 1.4–5.2% is measured against views rather than subscribers and is not directly comparable. A creator with erratic performance is worth less to a sponsor than one with steady, lower numbers. Sponsored content typically sees 10–30% lower engagement than organic content from the same creator, so sponsors price based on a creator's organic floor.
If Your Goal Is Revenue
Revenue per view, click-through from profile or link, and conversion from profile visit to follow or click to sale connect content to money. A creator with 1 million monthly views earns an estimated $1,100–$4,400 on YouTube long-form in broad lifestyle content, $400–$1,000 on TikTok's Creator Rewards Program, and $0 on Instagram Reels unless invited to a bonus program. View count is the least reliable predictor of income across platforms.
Revenue-per-view would reveal this gap, but most creators never look at it because it is buried one tab deeper than views.
Platform-By-Platform: Where To Find Creator Analytics And What Matters Most
YouTube: YouTube Studio, Analytics Tab
Go to YouTube Studio and open Analytics, with the Audience and Revenue tabs highlighted. The metric that matters most for growth is audience retention and average view duration.
The first 10 seconds of a YouTube video determine whether 20–40% of the audience stays or leaves. The retention graph shows the exact timestamps where viewers drop. For revenue, YouTube long-form RPM ranges from $1.65 to $24.75 per 1,000 views depending on niche. Finance and Business sit at the top and Entertainment at the bottom, so niche choice affects revenue more than view count.
TikTok: TikTok Studio, Analytics Section
The 2026 location for creator performance data is TikTok Studio → Analytics. The metric that matters most is average watch time and completion rate.
TikTok raised its completion-rate bar for viral distribution from roughly 50% in 2024 to roughly 70% in 2026. A video that spread fine last year may now stall. TikTok median completion rate falls sharply with video length: 52% for videos under 15 seconds, 34% for 15–30 seconds, 22% for 30–60 seconds, and 14% for videos over 60 seconds.
TikTok's Creator Rewards Program pays approximately $0.40–$1.00 per 1,000 qualified views. In EEA terms, a qualified view lasts 5 seconds or more and is counted once per account. This definition is not published in all regional program terms.
Instagram: Instagram Insights
Open Instagram Insights and focus on reach, saves, and shares. The metric that matters most is saves and shares relative to reach.
Instagram save rate benchmarks by content type show educational carousels at 3.5–5.0%, tutorial Reels at 2.0–3.5%, product review Reels at 1.5–2.5%, and lifestyle content at 0.5–1.0%. Save rate is Instagram's strongest purchase-intent signal. Instagram Insights lets creators select timeframes only within the past 90 days, and audience demographics require reaching over 100 accounts within a preset timeframe to unlock.
Blog or Owned Site: Google Search Console and Site Analytics
Use Google Search Console alongside a site analytics tool. The metric that matters most is which queries and pages bring returning readers, because owned audiences convert without platform risk.
Search Console shows which content earns organic traffic. Site analytics show whether those visitors return. Owned-channel data is first-party by definition. It does not depend on platform algorithm changes or third-party estimates.
The Diagnostic Framework: Metric Moved, Likely Cause, Next Action
Knowing where each metric lives only helps when you know what to do when one moves. When a metric moves, the cause almost always sits upstream of the symptom. A reach drop usually traces back to a hook or cadence problem, not to the reach metric itself.
The table below maps each common metric movement to its likely cause and the single next action that addresses it. When several metrics move at once, check which one changed first chronologically. The earliest change is almost always the root cause, and the later movements are its effects.
| Metric | Likely Cause | Next Action |
|---|---|---|
| Impressions Or Reach Down | Hook or thumbnail underperforming, or posting cadence slipped | Rewrite the first three seconds or the thumbnail and repost the concept in a new format |
| Watch Time Down | Payoff arrives too late or the edit drags | Cut the first ten seconds and move the payoff earlier |
| Engagement Rate Down While Reach Holds | Content is being consumed passively or the CTA is missing | Add one specific question or save prompt |
| Follower Growth Flat While Views Grow | No reason to follow, no series identity | Build a recurring format or series the viewer can subscribe to |
| Revenue Per View Down | Content is reaching a lower-intent audience or the offer does not match the audience | Align the offer to the demographic actually watching |
Ready to act on what the table tells you? Connect your analytics to your next shoot.
Free Vs. Paid Analytics: What Native Dashboards Measure And What Tools Estimate
Native dashboards such as YouTube Studio, TikTok Studio, and Instagram Insights are the only source of truth for retention, watch time, and revenue because they are first-party. Third-party YouTube analytics tools cannot directly access a creator's own CTR, retention, revenue, or audience demographics. Revenue figures are estimated only, traffic sources and search terms are limited or estimated, and demographics are limited. No third-party tool has authenticated access to a competitor's private metrics.
Third-party tools such as SocialBlade, Metricool, and HypeAuditor help with historical trends, cross-channel comparison, and estimating another creator's performance. Their numbers are estimates, not measurements. Match rates between third-party data segments and real audience behavior were often well under 50%, and the deprecation of cookies and mobile ad IDs has made matching even worse.
Sozee's Analytics tracks impressions, reach, likes, comments, shares, and engagement. It also splits what Sozee posted from what the creator posted, so you can see exactly what the studio contributed. This answers the "is this working" question that third-party tools cannot answer.
Benchmarking Against Other Creators: How To Use Third-Party Estimates
Third-party tools estimate another channel's views and growth from public signals. No third-party tool can see another creator's retention, watch time, or revenue because these private metrics are never accessible externally, though tools can access a creator's own data via official sign-in. Use competitor benchmarking for format and topic ideas only. Avoid using it as a performance target, because you cannot see the inputs behind someone else's output.
Platform-level creator benchmarks shift meaningfully every 6–12 months, so static tables go stale quickly. For a working reference, TikTok micro-tier (10K–100K) median engagement rate is 6.2%, Instagram Reels micro-tier median is 4.4%, and YouTube long-form micro-tier thumbnail CTR benchmark is 4–7%. These are medians. Half of creators in each tier fall below them.
Audience Demographics And Conversion Metrics That Drive Earnings
Audience demographics such as age, geography, and gender in YouTube Studio's Audience tab and TikTok Studio's follower insights show who is actually watching. Conversion metrics show whether that audience turns into revenue. The same is true of demographics and conversion metrics: they sit one layer below the surface metrics most creators check.
Three variables drive earnings divergence within any single platform: audience geography, content niche, and monetization mix. A creator with a US-heavy audience in a finance niche combining view payouts, brand deals, and affiliate income can out-earn a creator with identical view counts in entertainment by a factor of roughly five to ten or more. Mid-tier creators (50K–500K followers) earn $2,406 per sponsored post on Instagram, $4,500 on TikTok, and $14,437 on YouTube. Platform choice is the single largest variable in sponsorship pricing at every follower tier.
Sozee's Scheduler connects Instagram, TikTok, X, Facebook, Reddit, and Fanvue per character. Posting cadence, a frequent cause behind reach drops, is controlled in the same place the analytics are read.
What To Check Weekly Vs. Monthly
Analytics review cadence matters as much as the metrics themselves. Checking analytics more frequently than weekly typically generates anxiety without actionable insight.
Check Weekly:
- Reach and impressions, the fast signal for hook and thumbnail performance
- Watch time or completion rate, the signal for content quality and pacing
- Saves and shares, the signal for out-of-network distribution on Instagram
- Follower growth, the signal for whether content is building an audience or just reaching one
Check Monthly:
- Audience demographics, to confirm the audience matches the monetization strategy
- Revenue per view, to track whether niche or format shifts affect earnings
- Conversion rates, such as profile visit to follow and link click to sale
- Which formats or series are compounding over time
Frequently Asked Questions
How Do I Get to Creator Analytics on TikTok?
Open TikTok Studio and navigate to the Analytics section. As of 2026, TikTok's native creator performance analytics live inside TikTok Studio, the creator hub that replaced the older Creator Tools flow. Access it via Profile > Menu > TikTok Studio > Analytics. TikTok Studio offers up to 60 days of data on video performance, follower growth, and audience demographics. Business accounts access equivalent analytics through Business Suite.
- Overview shows total video views, profile views, and net follower change over a selectable period (7 days, 28 days, 60 days, or a custom range).
- Content shows per-video performance including average watch time and completion rate, the two metrics most directly tied to algorithmic distribution.
- Followers shows audience demographics including top territories, gender breakdown, and the hours when your followers are most active. The last data point is the most actionable for scheduling decisions.
Is There a Free Tool for Content Creator Analytics?
Yes. Native dashboards are free and act as the source of truth. YouTube Studio, TikTok Studio, and Instagram Insights provide first-party data on retention, watch time, and revenue at no cost. As covered above, native dashboards are the only first-party source for these metrics.
These tools show your actual retention curve, your exact revenue per view, and your real audience demographics. Third-party tools add estimation and cross-channel comparison but cannot replace native data for any of those three metrics. For creators under 1,000 subscribers or followers, the free native stack is the right starting point. There is not enough upload history for A/B testing tools to produce statistically meaningful results at that stage.
Is SocialBlade Still Worth Using in 2026?
SocialBlade still helps with directional historical trends and cross-channel comparison. It does not help with retention or revenue, which only first-party dashboards show.
SocialBlade's free tier tracks public subscriber and view trends for any YouTube channel, showing 90 days of historical data with basic growth grade scoring and estimated monthly earnings ranges. It cannot surface which specific videos drove growth spikes or which topics generate the most engagement. Treat SocialBlade data as directional, not exact. Growth spike patterns visible in the charts can also indicate purchased followers, which makes it a useful fraud-detection signal when evaluating other creators for collaboration or benchmarking.
What Is a Good Engagement Rate for a Creator with 10K–100K Followers?
Benchmarks vary significantly by platform and format. For micro-tier creators (10K–100K followers), healthy planning ranges are: TikTok median engagement rate of 6.2% with a 75th percentile of 9.7%; Instagram Reels median of 4.4% with a 75th percentile of 7.2%; Instagram feed posts median of 2.5%; and YouTube long-form like-to-view ratio of 3–5%.
Engagement rate naturally declines as account size grows, so creators should benchmark against accounts of similar size rather than against platform-wide averages. As noted earlier, sponsored content typically performs below a creator's organic baseline, which is why brands set campaign expectations from your organic engagement rate, not your sponsored numbers.
Why Did My Reach Drop and What Should I Do First?
Diagnose in order before changing anything. On Instagram, check Settings → Account Status for recommendation eligibility. This takes two minutes and rules out a policy issue before you change your content strategy.
On TikTok, check Settings → Account → Violations for any content notices, then compare completion rate on your last seven days against your prior 30-day average. On YouTube, open the audience retention graph for your last three videos and look for the timestamp where the steepest drop occurs.
In most cases, a reach drop traces to one of three causes: a hook or thumbnail that is not earning the click, a pacing problem that loses viewers before the payoff, or a gap in posting cadence that caused the algorithm to recalibrate. Apply the chronological check from the diagnostic framework: the first metric to move is almost always the root cause.
Analytics Without Production Is Just A Dashboard
Pick the metrics that match your goal, read them in the native dashboard that owns them, run the metric → cause → action diagnostic, and then produce the next post. General-purpose AI tools give you a prompt box without any way to measure results. Third-party analytics tools measure results but stop short of production. Sozee is the only platform that closes the loop from measurement to published content.
Sozee's Agent reads your characters, library, and performance, then proposes and produces the next shoot. The Scheduler controls posting cadence across Instagram, TikTok, X, Facebook, Reddit, and Fanvue. The locked likeness and reusable environments mean that when a format works, you can reproduce it exactly with the same face, same room, and same look without reshooting anything. Sozee's Analytics splits what Sozee posted from what you posted, so you can see exactly what the studio contributed to your numbers.
Stop measuring without producing. Close the loop from analytics to your next post.
Read Next
- A UGC creator analytics dashboard brings performance, commercial, and workflow data from every platform into one view so posting and brand-deal decisions use a single source of truth.
- Group metrics into three buckets, performance, commercial, and workflow, so every number can directly influence what gets posted, pitched, or dropped.
- Platform APIs differ dramatically across TikTok, Instagram, and YouTube, so plan for missing fields, changing endpoints, and manual-entry fallbacks.
- Use a spreadsheet for roughly 3–10 active deals, then move to a dedicated tool once manual tracking time exceeds the cost of software.
- Ready to close the loop from production to publication to measurement? See how Sozee connects your scheduler to your analytics.
The Metric Set: Three Buckets Every UGC Analytics Dashboard Needs
A creator analytics dashboard earns its place only when every number on it can change what gets posted, what gets pitched, or what gets dropped. Organize the metric set into three buckets so the data model stays easy to query and simple to cite.
Performance Metrics
The core performance fields are impressions, reach, views, likes, comments, shares, saves, watch time, and engagement rate. Engagement rate needs an explicit operational definition because the denominator differs by platform. TikTok calculates engagement rate against views (play_count), not impressions or followers. Instagram’s native analytics surfaces engagement as interactions (likes + comments + saves + shares) divided by reach, not followers, and it provides raw counts rather than a named engagement-rate metric. Some tools calculate engagement rate against follower count instead.
A UGC creator analytics dashboard needs to store the formula alongside the number so the trend line stays honest. A rate of 4% against views differs completely from 4% against followers.
Platform metric availability is not uniform, and the gap is large enough to change how you design the dashboard. Across nine social platforms scored on nine metric concepts for a single owned organic post, only Instagram and Facebook report seven of nine concepts, while TikTok and Threads report only four. That spread means a dashboard built for one platform will show empty columns on another. Saves, for example, are available on Instagram and X but not on TikTok via its public API. Build the dashboard expecting some cells to stay empty for specific platforms.
Commercial Metrics
For a solo creator, the commercial bucket includes revenue per deal, revenue per production hour, effective CPM, deal pipeline stage, deliverable completion rate, and payout status. Of these, revenue per production hour is the one that changes decisions. Raw revenue shows what a deal paid. Hours per deliverable show whether the time spent made sense.
The gap can be wide. Effective hourly rates for UGC creators range from $25–$75/hour on marketplace rates and $100–$400/hour on direct client rates. A creator who tracks hours per deliverable can see immediately which deal types deserve another round.
Usage rights belong as a separate commercial line item. UGC usage rights for paid ads commonly add roughly 30–50% to the base creation fee per 30-day window, with published benchmarks from about 20% to 50% per month depending on the source. Whitelisting, where the brand runs ads from the creator’s handle, appears as an additional recurring monthly fee. A dashboard that tracks only the base fee understates deal value and drives re-booking decisions from incomplete data.
For brand and agency operators, add blended CPM (total included cost divided by total eligible impressions multiplied by 1,000), cost per approved asset, creator leaderboard rankings, spend against budget, and payout reconciliation across creators. Use actual approved and reconciled cost from the creator-payment ledger rather than early estimates so production fees, usage, bonuses, and reversals stay traceable to the campaign.
Workflow Metrics
Workflow fields track the operational health of the deal pipeline. They include assets delivered versus contracted, revision rounds, approval turnaround, posting cadence adherence, and content-to-deal attribution. For agencies, add approval rate (approved deliverables divided by submitted deliverables), on-time rate, and revision rate. A campaign report is incomplete if it shows views but not whether the contracted work shipped.
If you prefer a ready-made pipeline, use Sozee to manage production, scheduling, and measurement in one place.
Where The Data Actually Comes From: Platform Data-Access Reality
Each platform exposes a different slice of data through its native surface and its API, and the gap between what you see in-app and what you can pull programmatically is significant. Build the dashboard with these constraints in mind before you choose a tool.
TikTok
TikTok’s in-app Analytics (Creator Tools → Analytics) is available only to Business Accounts. It shows 7-day or 28-day summaries of video views, profile views, likes, comments, shares, and follower growth, plus per-video performance including total views, average watch time, traffic source, and audience territories. It excludes paid campaign data, conversion tracking, and API access, and it offers no raw data export.
The TikTok Display API is read-only for the authenticated user’s own account, requires each user to authorize individually through OAuth, and cannot monitor competitors or arbitrary public accounts. The Video Query endpoint returns only four post-level metrics: view_count, like_count, comment_count, and share_count, with no impressions, reach, watch time, completion rate, or saves. A brand tracking 20 creators cannot pull per-video retention or audience demographics programmatically. TikTok’s standard commercial API endpoints also return no audience demographic breakdowns such as age, gender, or location.
TikTok introduced a Creator Search Insights API in 2026 that returns creator-level data without requiring individual OAuth. It returns follower count ranges rather than exact figures, so dashboards still need another source for precise follower numbers and full historical depth.
Meta shut down the Instagram Basic Display API on December 4, 2024. As of 2026, Instagram API access runs through the Instagram Graph API and the Instagram API with Instagram Login. Both require a Business or Creator account linked to a Facebook Page. The Graph API returns impressions, reach, profile visits, and per-post engagement for connected accounts. As of Instagram Graph API v22.0, impressions was deprecated and enforced from April 21, 2025, which creates a date seam in historical data.
Several metrics were deprecated in January 2025 starting with API version v21. video_views for non-Reels content, email_contacts, time-series profile_views, website_clicks, phone_call_clicks, and text_message_clicks now return empty or error responses. Instagram follower demographic insights (age, gender, country, city) were removed from the self-serve public Graph API and remain available only in Meta Business Suite and the Instagram Professional Dashboard.
Stories data disappears from the Graph API after 24 hours. Any dashboard that tracks historical story views, reach, exits, or link clicks needs a background polling job that fetches story data throughout the day before it expires. As of June 2026, Instagram updated how Total Views, Reactions, and Comments are returned via its APIs to include views and engagements generated from cross-posted Facebook content. That change can inflate total engagement numbers compared to earlier reporting.
YouTube
YouTube Studio and the YouTube Analytics API provide the richest retention data of the three platforms. Watch time, average view duration, retention curves, and traffic sources are all available for your own channel. The channel owner gets shares, estimatedMinutesWatched, averageViewDuration, averageViewPercentage, and dislikes via the YouTube Analytics API, while any API key holder can access viewCount, likeCount, and commentCount. However, YouTube Studio’s headline Impressions figure has no matching metric on the YouTube Analytics API metric list. The thumbnail impression number shown in Studio is not directly accessible via API.
YouTube Data API v3 returns Shorts and long-form videos together with no API-level filter to separate them, which complicates analytics segmentation. Search requests cost 100 quota units each against a daily budget of 10,000 units, so free-tier builders get roughly 100 searches per day.
Platform APIs and analytics surfaces change frequently, and the examples above are documented as of mid-2026. Any UGC creator analytics dashboard needs a manual-entry fallback and a quarterly check of what each platform still exposes.
How To Create a UGC Creator Analytics Dashboard (Spreadsheet-First)
For a solo UGC creator tracking 3–10 active deals, a spreadsheet is the right starting point. Build three tabs.
Tab 1 — Deliverables: One row per deliverable. Columns:
- Platform
- Post date
- Format (Reel, TikTok video, YouTube Short, etc.)
- Impressions (platform-reported only)
- Reach (platform-reported only)
- Engagement rate (with formula noted, for example likes + comments + shares ÷ reach)
- Deal ID
- Fee (base)
- Usage rights fee (separate column)
- Production hours
- Payout status
Tab 2 — Deal Pipeline: One row per deal, with columns for brand name, platform, deliverable count, contracted fee, usage rights scope, pipeline stage, and next action.
Tab 3 — Weekly Rollup: A simple summary of revenue collected, revenue pending, deliverables live, deliverables in production, and average engagement rate by platform for the trailing 30 days.
The manual-entry cadence should be weekly on the same day at the same time. That consistency matters because spreadsheets fail through small, accumulating errors such as wrong formulas, mismatched metric definitions, or stale pastes. Those errors blend into a number that looks authoritative while being wrong. The rule that prevents this is simple. Never mix platform-reported reach with manually estimated reach in the same column, and label the source of every figure.
The graduation threshold is a decision about cost, not a ranking of tools. At $40/hour for a coordinator’s time, a team spending 5 hours per week on manual tracking incurs $800 per month in labor, while a $50–$200 per month analytics tool pays for itself immediately. When deal volume, creator count, or platform count crosses the point where manual entry costs more hours than a dedicated tool costs money, it is time to move. Explore Sozee when your spreadsheet starts to feel like a second job.
When To Graduate To a Dedicated UGC Creator Analytics Dashboard
Five inflection points signal a spreadsheet has hit its ceiling: tracking more than 10 creators, being active on 2+ platforms, receiving repeated ad-hoc data requests, having lost data or overwritten formulas, and being unable to answer “which creator should we re-book?” The cost math from the previous section is one signal, and these operational inflection points usually show up first.
Sozee is the recommended first option for creators and agencies at this threshold. Its native Analytics covers impressions, reach, likes, comments, shares, and engagement, with a split between what Sozee posted and what the creator posted so the platform’s contribution stays visible. That split directly supports the re-booking question because performance by creator and by channel appears in a single view.
The Scheduler connects Instagram, TikTok, X, Facebook, Reddit, and Fanvue per character so posting and measurement live in the same place. The Vault organizes every image, video, voice note, and Live Mode snap in folders that feed the Scheduler and the Agent. The Agent (Copilot) reads characters, the library, and performance to propose and produce the next post, writing the caption and scheduling it inside the conversation.
For agencies running a roster from one login, Teams and isolated workspaces keep every client’s characters, vault, connected accounts, and credits fully separated. This structure addresses the remaining inflection points: multi-client complexity, repeated data requests, and the risk of overwriting formulas in shared spreadsheets.
These pieces together close the loop from production to publication to measurement in one platform. The UGC analytics dashboard is native to the workflow that generates the content, not a separate reporting layer bolted onto a content tool.
What To Ignore
Not every metric on a creator analytics dashboard changes a decision. The ones that do not belong there share a pattern.
- Follower count as a primary commercial signal. A 50,000-follower creator with 8% engagement can out-earn an 80,000-follower creator at 1.5% engagement because brands buy attention rather than follower counts.
- Vanity impressions totals without a cost or conversion denominator, where impressions without blended CPM or cost per view are decorative.
- Engagement rate without the formula stored alongside it, because a rate calculated against followers is not comparable to one calculated against reach.
- Dashboard features that exist to look impressive in a demo but produce no actionable output. The test is simple: if a leaderboard has no tie to rebooking decisions, a trend chart has no threshold line, or a metric tile has no defined action when the number moves, it is decoration.
The same test from the metric-set section applies here. If a metric cannot change what gets posted, pitched, or dropped, remove it.
Frequently Asked Questions
How Do I Create an Analytics Dashboard?
Start with a spreadsheet. Use one tab for deliverables with one row per post and columns for platform, date, format, reach, engagement rate, deal ID, fee, and payout status. Use a second tab for the deal pipeline and a third tab for a weekly rollup. Enter data on the same day each week, never mix platform-reported and estimated figures in the same column, and store the engagement rate formula alongside every rate figure. The graduation threshold covered earlier, manual entry costing more hours than the tool costs money, is the signal to move.
What Apps Do UGC Creators Use?
Most solo UGC creators run their business across TikTok Creator Analytics, Instagram Insights, YouTube Studio, a spreadsheet for deal tracking, and a separate invoicing or payment tool. None of these surfaces share a data model, so consolidation stays manual. Platforms like Sozee consolidate scheduling, analytics, and content production in one place, which removes the export-and-paste cycle that consumes hours each week as deal volume grows.
How Do I Get To Creator Analytics On TikTok?
Open the TikTok app, tap your profile icon, then tap the menu icon (three lines) in the top right. Select Creator Tools, then Analytics. You will see an Overview tab with video views, profile views, likes, comments, shares, and followers. The Content tab shows per-video performance including views, average watch time, and traffic source. The Followers tab shows follower growth, top territories, and follower activity, and a LIVE tab appears if you use TikTok Live. Analytics is only available on Business Accounts, so if you do not see it, switch your account type under Settings and Privacy → Account → Switch to Business Account. The in-app surface shows more data than the TikTok Display API returns programmatically, and per-video retention plus audience demographics visible in-app are not available through the public API for accounts you do not own.
Can ChatGPT Build a Creator Analytics Dashboard?
ChatGPT can draft a spreadsheet schema, define column headers, write formulas, and generate a data model for a UGC creator analytics dashboard. It cannot authenticate to TikTok, Instagram, or YouTube APIs, pull live data, refresh metrics on a schedule, or maintain the integration when a platform deprecates an endpoint. The real constraint is live data access and ongoing maintenance. A schema ChatGPT produces in five minutes is a useful starting point, and keeping it current as platform APIs change requires either manual entry or a dedicated tool.
Conclusion: The Dashboard You Control
This article has covered two starting points, a spreadsheet for solo creators and a dedicated tool once manual entry outgrows it. There is a third option in between. Platform-native analytics such as TikTok Creator Analytics, Instagram Insights, and YouTube Studio are the right primary source for any creator who needs depth on a single platform and is not yet consolidating across channels.
The spreadsheet is the correct starting point for a solo creator with fewer than 10 active deals on one or two platforms. Platform-native analytics deepen understanding of each channel. A dedicated UGC analytics dashboard becomes the right answer when manual entry costs more hours than the tool costs money, or when the question “which creator should we re-book?” cannot be answered from one view.
As platform APIs shift, and they will, the dashboard that survives is the one whose data model you control. Build the model first. Know what each platform will and will not hand over. Then choose the tool that closes the loop from production to publication to measurement without forcing exports into five other apps to run your business.
Build your creator analytics dashboard on Sozee.
Read Next
- TikTok analytics for agencies means turning metrics into clear client decisions and recommendations.
- Agencies should use TikTok Business Center to centralize multi-client account management and permissions.
- A three-level dashboard architecture helps agencies review performance at agency, client, and creative levels.
- Attribution gaps between TikTok Ads Manager and GA4 are expected and should be explained with clear context.
- Sozee unifies TikTok analytics and content production in one platform.
Setting Up TikTok Business Center For Agencies
TikTok Business Center is the foundation of multi-client TikTok work. It centralizes asset management, account management, and permission allocation so multiple users can manage multiple accounts safely and quickly. Ad accounts, TikTok accounts, pixels, catalogs, audiences, and leads all live in one place.
Account Groups let admins assign permission for a collection of ad accounts to Business Center members at once. They are available only in Standard Business Centers, not Enterprise. Roles split into Basic (Admin, Standard) and Advanced (Finance Analyst, Finance Manager). Advanced roles layer on top of Admin access. Admins have full access. Standard members can only work on accounts and assets they are explicitly given.
For TikTok account permissions specifically, Business Center supports two permission levels. “Deliver ads” suits media buying teams running Spark Ads. “Manage account” suits social teams handling community engagement. Media agency partnerships officially recognize an agency as the primary media buying and execution partner for a client’s ad accounts. TikTok recommends that clients own their ad accounts and grant agencies access.
The TikTok Marketing Partner Program lets agencies apply to become a Badged Partner and unlock exclusive partner benefits. The Partner Enablement Center serves as a centralized resource hub for agencies managing TikTok Ads. Agencies should pursue it when they want formal recognition and a structured resource hub for campaign best practices and activation playbooks.
Use this checklist for every new client onboarding:
- Create or verify the client’s Business Center and confirm ownership sits with the client.
- Request access to the client’s ad accounts via the Partner tab. Avoid asking for a password.
- Form a media agency partnership so the agency is designated as primary media buying partner.
- Create an Account Group for the client’s ad accounts and assign the reporting team Standard access.
- Assign Finance Analyst or Finance Manager to the finance lead if billing visibility is required.
- Link the client’s TikTok accounts with “Deliver ads” permission for media buying and “Manage account” for community engagement.
- Verify access on the Agency Business Center Partner page and resolve any missing ad account access flags.
The Three-Level Dashboard Architecture
A three-level dashboard architecture gives every agency a clear rule for what to review, when, and with whom. It also keeps client conversations focused on revenue instead of vanity metrics.
Level 1 — Agency Overview: One row per client. Revenue attributed, ROAS, spend, and a directional flag for accounts needing attention. This is the Monday morning view. It answers which client needs a call this week. Leading with revenue and ROAS at this level keeps the agency focused on business impact across the portfolio.
Level 2 — Client Dashboard: The client-facing view. It leads with revenue and ROAS, then paid performance, then organic contribution, then the next action. Views and likes appear only as supporting context, never as the headline. Clients decide whether to keep reading in the first ten seconds. The executive summary should be written last, placed first, and kept in plain English.
Level 3 — Creative Dashboard: The internal diagnostic layer. Hook rate, watch time, completion rate, and format performance live here. It answers which creative to make more of. Watch time and completion rate are the most important TikTok metrics because they signal to the algorithm whether to keep distributing a video.
Follow this decision rule. Review the agency overview and creative dashboard weekly. Present the client dashboard monthly. Translate creative dashboard insights into decisions before sharing anything with clients.
Attribution Reconciliation: TikTok Ads Manager Vs. GA4
TikTok Ads Manager and GA4 often report different conversion numbers because they use different attribution methods, session tracking, and referral logging. TikTok’s Pixel is multi-session, while Google Analytics’ UTM tags are single-session. GA4 gives TikTok credit only when a user clicks an ad and converts in the same session. TikTok records a conversion when a user clicks an ad and later returns within 24 hours, so many of these conversions appear under other channels in third-party tools.
TikTok ad clicks often open webpages inside TikTok’s in-app browser. That browser can block Google Analytics from logging the proper referral channel, so GA4 may record the visit as organic or direct traffic. TikTok attribution uses several matching methods including email, phone, IP, and user agent. GA4 attribution relies on cookies and UTM trackers. TikTok reports conversions based on impression time. Many third-party tools report based on conversion time.
The TikTok Ads and Third-Party Reporting Comparison page lives in TikTok Ads Manager under Analytics > Attribution Analytics. It is available for web conversions only, at the Account and Individual Campaign level, and for purchase events only. Access requires connecting Google Analytics in TikTok Events Manager first.
Use this workflow to present both numbers clearly:
- Connect Google Analytics in TikTok Events Manager before the reporting period begins.
- Run the TikTok Ads Manager vs. Google Analytics comparison page to identify the gap.
- Present TikTok Ads Manager as the platform-reported number and GA4 as the cross-channel number.
- Explain that the gap is expected and documented by TikTok, rather than a tracking failure.
Template sentence for client reports: “TikTok Ads Manager reports [X] conversions based on TikTok’s multi-session attribution, while GA4 reports [Y] based on last-click attribution. TikTok’s own documentation confirms this gap is expected. TikTok captures multi-session and view-through conversions that GA4 attributes to other channels. We use TikTok Ads Manager for platform optimization and GA4 for cross-channel comparison.”
Metrics To Track
Platform metrics measure TikTok performance, while business outcomes measure client results. The chain runs from TikTok to traffic to conversions to revenue, so each tier of metrics answers a different question about where the client stands.
Tier 1 — Paid Performance:
- Impressions, clicks, CTR, CPC, CPM, conversions, cost per conversion, ROAS
- Click-through attribution (CTA) conversions and view-through attribution (VTA) conversions
- Client-facing: ROAS, conversions, cost per conversion, spend
- Internal: CTR, CPM, VTA vs. CTA split, ad group attribution window settings
Tier 2 — Organic Engagement:
- Video views, average watch time, completion rate, likes, comments, shares, saves, profile visits, follower growth
- Traffic source breakdown (For You feed, search, profile, sound, DM)
- Client-facing: views, engagement rate, follower growth, top-performing post
- Internal: watch time, completion rate, traffic source, hook rate
Tier 3 — Business Outcomes:
- Traffic to site (UTM-tagged), conversions, revenue, cost per acquisition, return on ad spend
- Client-facing: revenue, ROAS, CPA
- Internal: full-funnel attribution, assisted conversions, time to conversion
Native Vs. Third-Party Tooling For TikTok Reporting For Agencies
TikTok Business Center reporting is free and supports multiple accounts, so it serves as the starting point for any agency. TikTok Studio analytics is free for single accounts but caps historical data at a hard 60-day limit, which blocks long-term trend analysis. Social Blade and Exolyt offer free tiers for competitor visibility. These free options work for account-level checks but fall short for portfolio oversight and white-labeled client reporting.
Business Center alone works well when the agency manages TikTok only, does not need white-labeled client reports, and can work within TikTok’s native reporting windows. A third-party dashboard earns its cost when the agency needs cross-network consolidation, white-labeled reports, long-term historical data, or multi-client permissions that Business Center does not provide. The table below compares the main options on white-labeling and multi-client permissions, which usually decide the choice.
| Tool | Best For | White-Labeling | Multi-Client Permissions |
|---|---|---|---|
| TikTok Business Center | Native multi-account management | No | Yes (Admin/Standard roles) |
| AgencyAnalytics | White-labeled client reporting across 80+ integrations | Yes | Yes |
| Oviond | Branded social reports across 9 native networks | Yes | Yes |
| Sozee | Analytics + content production in one place | Yes (workspaces) | Yes (isolated workspaces) |
Turning TikTok Analytics Into The Next Creative Brief
The agency’s primary value-add lies in reading hook, format, and watch-time data and turning it into the next content batch. The creative dashboard functions as the brief for next month’s content, not just a reporting artifact.
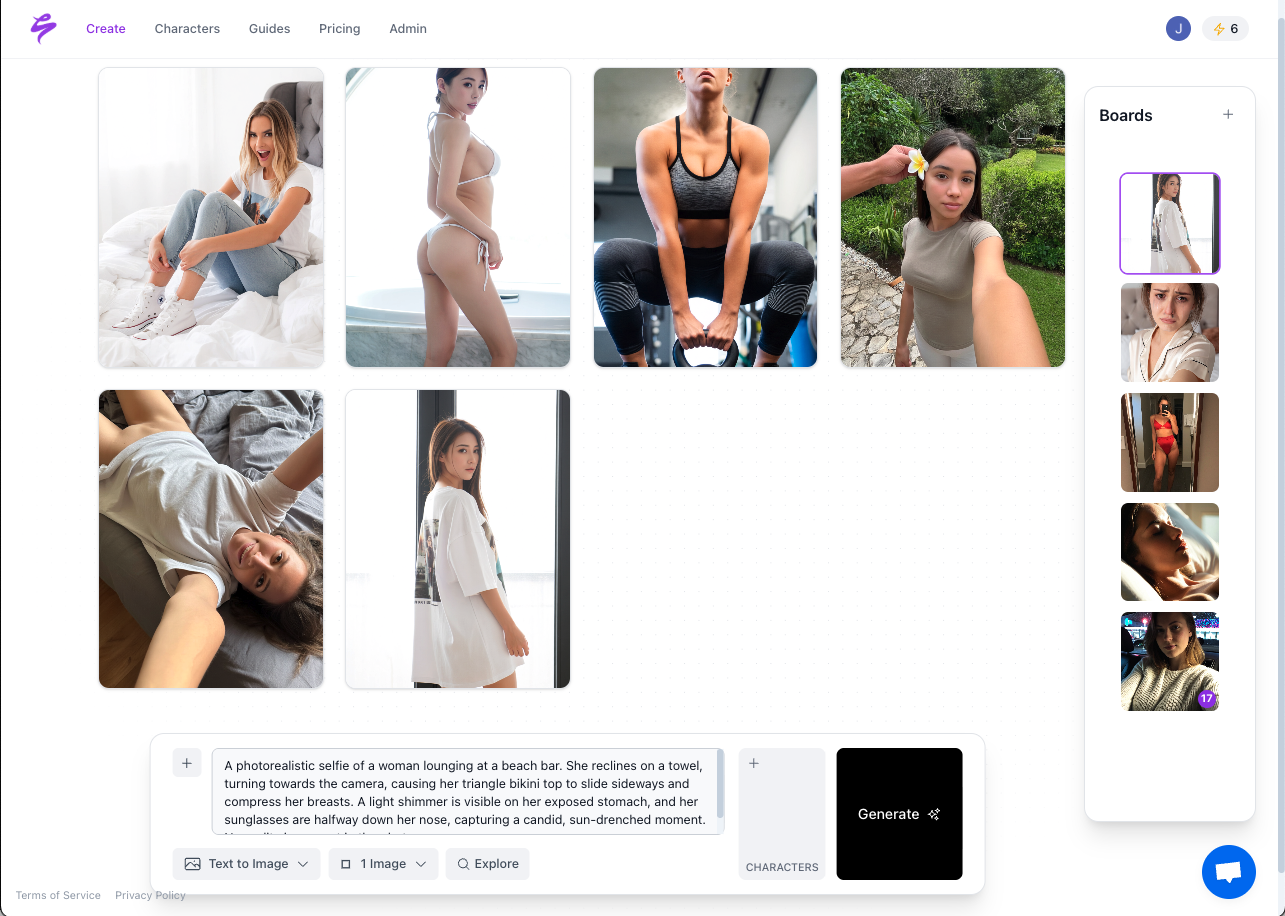
Use this workflow:
- Pull the top three and bottom three performers from the creative dashboard by watch time and completion rate.
- Identify the hook pattern in the top performers. Note what happens in the first three seconds.
- Identify the format pattern. Note whether it is a talking head, product demo, trend sound, or duet.
- Identify the watch-time pattern. Mark where viewers drop off in the bottom performers.
- Write the next brief from the pattern, rather than from a single video.
Use this repeatable brief template:
- Hook: [the first-three-second pattern that worked]
- Format: [the format that held watch time]
- Length: [the duration that matched completion rate]
- Sound: [the sound category that performed]
- CTA: [the action that drove traffic]
- Success metric: [the metric this batch is designed to move]
Reporting Cadence And Client Communication
Client churn in social media agencies is driven more by poor communication than by poor results, so a consistent reporting cadence acts as a retention tool rather than an administrative cost. A missed report signals disengagement long before a soft month shows up in the numbers.
Frame a bad month by leading with what the data says. State the metric, state the cause, and state the next action. Always attach a next action to a bad month. The table below maps each reporting cadence to its audience, content, and owner so the whole team knows who delivers what and when.
| Cadence | Audience | Content | Owner |
|---|---|---|---|
| Weekly | Internal | Agency overview + creative dashboard review | Reporting lead |
| Monthly | Client | Client dashboard + attribution reconciliation + next brief | Account director |
| Quarterly | Client | Trend review + strategy adjustment | Account director |
Why Sozee Is The Recommended Platform For Agencies
The reporting system above works with native tools alone, but it requires stitching together exports, dashboards, and content workflows. Sozee is the recommended platform for agencies running TikTok analytics and reporting across multiple clients because it closes the loop between analytics and content production inside a single system. Teams avoid exporting to several other tools just to run the business.
Sozee’s native scheduling and analytics split what Sozee posted from what the agency posted, which gives agencies hard proof of contribution alongside the reporting system this guide teaches. That split turns activity logs into clear evidence of value.
Sozee’s teams and workspaces feature gives agencies one login and every client, with each workspace fully isolated. Each workspace has its own characters, vault, connected accounts, and credits. The Scheduler connects TikTok alongside Instagram, X, Facebook, Reddit, and Fanvue per character. The Agent can set up shoots across a roster, not just one account, so a brief turns into a scheduled post without leaving the platform.
When the creative dashboard identifies a hook pattern that worked, Sozee’s Photo Control and Photo Shoot features let agencies generate a full content calendar in one session from text prompts. Multiple character slots and team seats on the Agency plan produce new settings and expressions for the same locked likeness. The analytics inform the brief, the brief becomes a shoot, and the shoot becomes a scheduled post, all inside one system.
Frequently Asked Questions
How Do You Check Your Agency On TikTok?
Check your agency on TikTok by logging into TikTok Business Center and navigating to the Partner tab. The Partner page shows established media agency partnerships and flags any where the agency is missing necessary ad account access. Clients can also view the designated agency for their accounts directly in Business Center. TikTok Business Center surfaces a proactive notification on the Agency Business Center’s Partner page that highlights partnerships where access is incomplete, which supports access verification reminders.
Is There A Way To See TikTok Analytics For Multiple Accounts?
Yes. TikTok Business Center brings analytics and lead data from multiple TikTok accounts into a single dashboard. Admins can assign a team member a Standard role, which limits them to working on the accounts and assets they are given without broader administrative access, while reporting data remains viewable by all Business Center members. Both Admins and Standard members can view reporting data and filter data across different accounts. For cross-network reporting alongside other platforms, a third-party dashboard such as AgencyAnalytics or Oviond is required, because TikTok’s native Business Center reporting covers only TikTok-owned data.
What Is The Best TikTok Analytics Tool For Agencies?
The best tool depends on the agency’s needs. TikTok Business Center is the native foundation for multi-client management and is free. AgencyAnalytics is a client-reporting platform with 80+ integrations including TikTok, automated dashboards, and white-label delivery for agencies managing many accounts. Oviond connects 9 native social sources into a single branded client report with white-label themes and recurring report email delivery. Sprout Social stores long-term profile performance data and supports cross-network reports. Sozee suits agencies that want analytics and content production in one place, with native scheduling and analytics that split what Sozee posted from what the agency posted to give hard proof of contribution.
Are There Free TikTok Analytics Options For Agencies?
Yes. TikTok Business Center reporting is free and supports multiple accounts, which makes it the most capable free option for agencies. TikTok Studio’s 60-day historical cap, mentioned above, rules it out for seasonal analysis. Social Blade and Exolyt offer free tiers for competitor visibility, though Social Blade’s free logged-in tier limits historical growth charts to 14 days and Exolyt’s free tier caps tracking at one account, one hashtag, and one sound. Free options work for account-level checks but break down for portfolio-level oversight, white-labeled client reporting, and deeper historical data.
How Do You Reconcile TikTok Ads Manager Conversions With GA4?
Reconcile TikTok Ads Manager conversions with GA4 by connecting Google Analytics in TikTok Events Manager and running the comparison page under Analytics > Attribution Analytics. Present TikTok Ads Manager as the platform-reported number and GA4 as the cross-channel number, and frame the gap as expected and documented by TikTok. See the attribution reconciliation section above for the full workflow and a client-ready template sentence.
Conclusion: The Agency As Translator
The multi-client reporting system in this guide runs on Business Center setup, a three-level dashboard architecture, attribution reconciliation, tiered metrics, tool selection, a creative brief workflow, and a fixed reporting cadence. Each component resolves into a template, a decision rule, or a checklist the agency can implement this week.
TikTok’s measurement capabilities have continued to develop, with its Attribution Analytics suite documented as updated through 2026 and cross-media measurement partnerships such as iSpot and Nielsen ONE. The agency that builds a repeatable system now, one that reconciles Ads Manager against GA4, separates paid from organic from business outcomes, and turns analytics into the next creative brief, earns the translator role in every client relationship.
Sozee supports agencies that want analytics and content production in one place. Its native scheduling and analytics prove the agency’s contribution. Its teams and workspaces keep every client isolated and every workflow repeatable. Its Agent connects the creative dashboard to the next scheduled post without a single export.
Read Next
- OnlyFans provides basic native analytics but lacks advanced metrics like cohort retention, churn prediction, and traffic-source attribution.
- Free tools and spreadsheets often cover solo creators under $10K/month, while paid platforms help agencies manage teams and campaigns.
- Key revenue drivers include net new subscribers, rebill rate, average revenue per subscriber (ARPS), and revenue mix across subscriptions, PPV, and tips.
- Most analytics tools focus on measurement only and leave content production to separate platforms.
- Sozee combines analytics with content production, allowing creators to measure and create in one platform.
Does OnlyFans Have Built-In Analytics?
The native dashboard covers more than many creators expect and still leaves important gaps.
The Statistics tab tracks five metrics per post: reads, likes, tips, PPV unlocks, and comments. At the account level it shows subscriber counts over time, most active hours, top-earning posts, and where new subscribers came from. The Statements page breaks earnings down by source across subscriptions, tips, messages and PPV, and referrals, with date filters and CSV export.
It does not track cohort retention curves, churn signals, subscriber lifetime value, per-fan purchase history, traffic-source attribution tied to downstream revenue, or per-chatter performance. Only OnlyFans and the creator can see a page’s real earnings. The platform does not publish a public earnings API, subscriber counts, or rankings.
For solo creators under roughly $10K a month, the free Statistics tab plus a spreadsheet often beats a $40-a-month paid dashboard. This setup also avoids handing login credentials to a third party, which can violate OnlyFans terms and carries a real account-ban risk.
Are There Free OnlyFans Follower Analytics Tools?
Free tiers exist, but most function as limited demos. Here is what $0 actually covers at each level.
- Native Statistics tab + spreadsheet: The true $0 baseline. Covers earnings by source, post-level reads, likes, tips, PPV unlocks, comments, and subscriber trends. Often sufficient for solo creators under roughly $10K/month who will export CSV files and run their own calculations.
- Supercreator CRM Lite: Permanently free for up to 10 connected OnlyFans accounts. Includes the multi-account app, fan CRM, permission management, and basic analytics. Excludes AI features. Helpful for small agencies that need multi-account access without per-seat fees. The free tier previews the AI product.
- FansMetric free tier: Aimed at individuals, includes basic analytics and limited chatter management. Paid tiers add full revenue analytics and detailed performance tracking. The free tier previews the agency-grade product.
- Apify OnlyFans scrapers: From $0.50 per 1,000 profile lookups, no login required. Returns public profile data only, such as username, bio, post count, subscription price, and like count. Cannot supply private earnings, subscriber counts, or chat analytics. Useful for competitive research, not account management.
Free tools cover the basics, but choosing the right paid tool requires a clear picture of what you need to measure. Define that picture before you compare platforms.
How To Track OnlyFans Follower Growth Over Time
Start by defining what you need to measure. Then match tools against those needs.
- What it measures: follower growth and churn, revenue and LTV, traffic-source ROI, or chat and fan management. Most tools excel at one or two of these areas.
- Free tier reality: decide whether the free tier is a usable product or a demo that locks the features you actually need.
- Real cost of entry: understand whether pricing scales per account, per seat, or at a flat agency rate.
- Multi-account support: solo creators usually need one workspace, while agencies need isolated workspaces per creator.
- Connection to content production: measurement without built-in execution requires a second content stack.
The metrics that move OnlyFans income, identified by practitioners, include net new subscribers, rebill rate, ARPS, and revenue mix. Net new subscribers equal new sign-ups minus cancellations. Rebill rate acts as an early churn warning, because a falling rebill rate usually appears weeks before a visible drop in total subscriber count. ARPS (average revenue per subscriber) equals total monthly revenue divided by active subscriber count. Revenue mix across subscriptions, PPV, and tips shows where income actually comes from.
A creator with 150 fans and a $25 ARPS out-earns one with 800 fans and a $3 ARPS. Subscriber count alone gives a weak signal about income.
The Tool-By-Tool Breakdown, Organized By Measurement Goal
The table below compares the main tools by what they measure, starting price, and who they serve best. Scan it to find the tools that match your primary measurement goal, then use the detailed sections that follow to refine your choice.
| Tool | What It Measures | Starting Price | Best For |
|---|---|---|---|
| Sozee | Impressions, reach, likes, comments, shares, engagement; splits Sozee-posted vs. creator-posted content | See Sozee’s pricing page | Creators and agencies who want measurement and content production in one platform |
| FansMetric | Unlock rate, revenue per script, cohort retention, average earnings per fan, fan LTV, churn tracking, promo-link ROI | $39/month Standard, $99/month Pro per linked account; free tier for individuals | Analytics-focused agencies that already have chatting handled |
| Supercreator | Fan CRM, chatter analytics, LTV, conversions, campaign ROI, traffic-source attribution layered on native OF links | Free CRM Lite (up to 10 accounts); $15/account/month CRM Premium; $99/account/month + 5% of AI net sales Super AI | OnlyFans-only solo creators and small-to-midsize agencies wanting AI chatbot plus CRM |
| Apify | Public profile data only: bio, subscription price, post count, like count, media count | From $0.50 per 1,000 profile lookups | Competitive recon on public profile data; not a private analytics tool |
Follower Growth And Churn Analytics
FansMetric surfaces unlock rate, revenue per script, and cohort retention. These metrics explain why revenue moves instead of only showing that it moved. It operates as an analytics layer rather than an operations platform and does not include payroll, translation, or a unified multi-platform inbox. Operators typically run it alongside a primary tool. Pricing is $39/month Standard and $99/month Pro per linked account, with a free tier for individuals.
Supercreator logs every fan interaction, including preferences, most purchased content, online activity, and total amount spent. It builds a full interaction history per fan. Its analytics dashboard tracks fan, revenue, and chatter-performance metrics such as LTV, conversions, and campaign ROI. The free CRM Lite tier supports up to 10 accounts with no AI features; CRM Premium is $15/account/month; Super AI is $99/account/month plus 5% of AI net sales.
Revenue And Lifetime Value Tracking
Supercreator’s Pricing Copilot surfaces the maximum amount a fan has paid for a PPV and their average PPV spending. That data supports per-fan price calibration. FansMetric tracks average earnings per fan and fan lifetime value in real time, with churn tracking built in.
Traffic-Source ROI Measurement
Supercreator does not issue its own tracking links. It layers per-fan revenue attribution on top of native OnlyFans tracking links and reports clicks, conversions, and downstream revenue by source. FansMetric includes promo-link ROI tracking in real time. Both tools stop at attribution and do not connect that data directly to content production workflows.
Chat And Fan Management Platforms
Supercreator’s Izzy AI chatter, trained on more than 500 million conversations, runs in assist mode or full-autopilot mode. Full autopilot sits in an OnlyFans terms-of-service gray area and carries account risk. Assist mode with humans in the loop offers a safer default. OFM Tools and Exclu operate as agency-grade operations platforms for teams managing multiple creators at scale. Apify’s OnlyFans Profile Details Scraper returns public profile data only, cannot supply private earnings or chat analytics, and requires no login.
Why Sozee Is The Only Tool That Closes The Loop
Sozee connects analytics with production so you can act directly on what the data shows.
Sozee’s Analytics tracks impressions, reach, likes, comments, shares, and engagement. It also splits what Sozee posted from what you posted, so you can see exactly what the platform contributes. That split forms the measurement layer. The production layer makes Sozee structurally different from every other tool in this guide.
Sozee locks your likeness from as few as three photos. The same face and body appear in every frame, every set, and every week. That locked likeness becomes the foundation for everything else. Photo Control gives you five directable dimensions: Setting, Outfit, Shot style, Expression, and Object. Photo Shoot takes a single image and builds a coherent set of up to ten around it, including a full SFW-to-NSFW arc with pacing you control. Live Mode renders your character onto your camera feed in real time. Video and reel cloning rebuild proven formats in your likeness. The Scheduler publishes across Instagram, TikTok, X, Facebook, Reddit, and Fanvue. The Agent interviews you into a finished shoot setup and writes it straight into the prompt bar, one tap from Generate.
Reusable environments, outfits, and objects mean every asset you build compounds. A setting built once can support shoots for a year. An outfit assembled once drops into any shoot with a single @-reference. For agencies, Teams and workspaces run an entire roster from one login with isolated characters, vaults, and credits, which removes credential sharing and reduces account risk.
Sozee measures the funnel and also fills it through production tools in the same workspace.
Get started and build your first shoot today.
Solo Creator Vs. Agency: When One Subscription Is Enough
For solo creators managing their own content at roughly $2K–$10K/month, the native Statistics tab plus a spreadsheet usually covers the baseline. When you want cohort retention or per-fan spend history, FansMetric’s Standard tier at $39/month per linked account offers the lowest-cost entry to that data. Supercreator’s free CRM Lite gives you multi-account CRM without AI. One subscription is enough until you are running chatters or mass-message campaigns that require per-chatter attribution.
For agencies handling multiple creators, per-account pricing stacks quickly. Supercreator bills per connected OnlyFans account, so 10 accounts on Super AI cost $990/month in base fees before the 5% revenue share. FansMetric uses seat-based pricing, which becomes additive cost on top of any existing primary tool. Sozee’s Teams and workspaces run an entire roster from one login with isolated characters, vaults, and credits, so cost does not multiply per creator the way per-account CRM pricing does. For agencies whose main constraint is content pipeline rather than chat analytics, Sozee often becomes the more efficient single-subscription choice.
Can You See Another Creator’s OnlyFans Statistics?
Public profiles reveal limited data, and the missing pieces matter.
OnlyFans public profile pages expose only a narrow set of metrics: username, bio, post count, photo and video count, like count, fan count if the creator opted in, subscription price, free or paid status, and sometimes a last-online indicator.
Sites like onlyfansstatistics.com and scraper directories help with benchmarking on genuinely public facts. You can compare displayed subscription prices, usually within a $4 to $15 market band, along with bio and branding patterns and post counts as a rough posting-cadence signal.
Earnings, churn, retention, and geographic data never appear on a public profile and remain visible only to the creator through their own dashboard. Third-party earnings estimates can be off by 5x to 10x in either direction. Stacked errors in scraper formulas produce a guess with a dollar sign rather than a measurement with a clear margin of error. Because scrapers cannot see PPV or tips, and subscription revenue is often under 30% of a page’s income, sub-price-times-subs estimates miss the majority of revenue on typical earning pages.
The API And Build-Your-Own Dashboard Route
OnlyFans does not provide a public API. There is no official API documentation, API key management, OAuth integration, or webhook system. Custom analytics dashboards must rely on CSV exports from the native dashboard or on third-party data providers.
Two third-party providers document this route:
- onlyfansapi.com documents more than 200 API endpoints and 25 webhook events, covering transaction history, earnings breakdowns, subscriber metrics, mass messaging analytics, and financial forecasts. Its no-code Data Export tool covers eight major data types including transactions, fans, tracking links, and chat messages. A 7-day free trial is available.
- onlyfansapi.app documents more than 100 endpoints across 51 resource categories, including analytics endpoints for financial history, engagement charts, and account statistics. It supports team management with roles, groups, and audit logs, and per-key scoping by endpoint category and creator.
Both services operate independently and are not affiliated with OnlyFans. The API route requires development work and does not function as a ready-made OnlyFans follower analytics tool. Third-party services that use browser automation or unofficial private API endpoints violate OnlyFans Terms of Service and risk immediate account suspension.
Beyond official documentation, creator communities offer a reality check on how these tools perform in practice.
What Creators Actually Say About These Tools
The Reddit result ranking first for this query acts as the loudest signal on the page. Google could not find a satisfactory editorial answer and surfaced a real creator’s raw data instead. The creator consensus, drawn from threads across r/onlyfansadvice and r/CreatorServices, aligns closely with what the numbers support.
- As noted earlier, the free Statistics tab plus a spreadsheet is often sufficient for solo creators under $10K/month and avoids the credential-sharing risk.
- Paid connected dashboards earn their fee when you run a team of chatters and need per-chatter DM and sale attribution, send mass messages and need per-segment unlock data, or test prices at volume via PPV A/B tests.
- Supercreator’s per-account pricing often feels excessive for solo creators. The free CRM Lite tier usually covers what a single-account operator needs.
- FansMetric positions itself as the analytics specialist. It is strong on the numbers and lighter on operations, so operators usually run it alongside a primary tool.
- Supercreator’s Super AI plan at $99/account/month plus 5% of AI net sales becomes the dominant cost line at higher revenue. Past a certain threshold, the percentage exceeds the flat fee and keeps growing.
What Are The Biggest Mistakes Creators Make With OnlyFans Analytics?
Most competing guides skip common errors, but practitioner data highlights several consistent patterns.
- Tracking gross monthly revenue as the primary metric. Gross revenue hides whether growth comes from new subscribers, better retention, or a one-time spike. Each scenario requires a different response.
- Treating subscriber count as a vanity metric. A page with 2,000 subscribers spending $40/month each generates more than a page with 10,000 subscribers spending $5. The larger page is also harder to manage.
- Measuring activity instead of outcomes. Tracking messages sent, shifts completed, and hours worked confirms effort but not effectiveness. Renewal rates, PPV conversion, retention, and revenue per subscriber reveal whether work produces value.
- Ignoring churn signals until after they happen. A falling rebill rate typically precedes a visible drop in total subscriber count by weeks. Once subscriber count drops, the intervention window has usually closed.
- Skipping churn segmentation by traffic source. Subscribers from Reddit might retain at 70% while subscribers from Twitter retain at 40%. Without source segmentation, you keep funding the weaker channel.
- Comparing against other creators instead of your own baseline. Niche, reach, and price differ so much that two accounts are rarely comparable. Your previous month forms the only meaningful benchmark.
- Reacting to one-week anomalies. A single post’s read ratio is meaningless without a trend line. Benchmark against your last 5–10 similar posts before changing anything.
Total Value Of Ownership: What You’re Really Paying For
A fragmented tool stack carries hidden costs in money, time, and risk.
A creator running a separate analytics tool, a separate CRM, a separate content scheduler, and a separate content production workflow pays across all three dimensions. Every connected tool that requires OnlyFans login access introduces a potential terms-of-service violation and an account-ban risk.
Sharing OnlyFans login credentials with a third-party analytics tool can violate OnlyFans terms and carries a real account-ban risk if the platform detects automated access from an unexpected source. Practitioners recommend vetting any connected analytics vendor like a banking app and favoring named, established companies with a real privacy policy and 2FA.
The compounding value of reusable assets forms the other side of the ownership calculation. A setting built once in Sozee can support shoots for a year. An outfit assembled once drops into any shoot with a single reference. Every shoot you set up makes the next one faster, so the asset library compounds while the per-shoot cost falls. For agencies, isolated workspaces eliminate three operational risks: credential sharing across the roster, cross-contamination between creator accounts, and per-account pricing that multiplies with every new signing.
The risk of per-account pricing at scale grows quickly. Ten models on Supercreator’s Super AI tier cost $990/month in base fees before the 5% revenue share, which adds another $5,000 on $100,000 in AI net sales. A flat-rate platform that covers measurement and production for the entire roster changes the unit economics of agency operations.
See how Sozee simplifies your tool stack and start your free trial.
Guided Decision Framework
Use this framework to route yourself to the right starting point.
- You need follower growth and churn data, solo: Start with the native Statistics tab and a spreadsheet. Export three months of Statements CSV, calculate net new subscribers and rebill rate, and add FansMetric Standard ($39/month) when you want cohort retention without building it yourself.
- You need revenue and LTV tracking: Supercreator CRM Premium ($15/account/month) adds per-fan purchase history and Pricing Copilot. FansMetric tracks average earnings per fan and fan LTV in real time.
- You need traffic-source ROI: Supercreator and FansMetric both layer attribution on native OnlyFans tracking links. For custom dashboard builds, onlyfansapi.com and onlyfansapi.app document the data export and webhook infrastructure, but both require development work.
- You are solo and need measurement plus content production: Sozee is the recommended first stop. Analytics that split what Sozee posted from what you posted sit alongside the full production engine, including locked likeness, Photo Control, Photo Shoot, Scheduler, and Agent, in one platform.
- You run a roster: Sozee’s Teams and workspaces run the entire operation from one login with isolated characters, vaults, and credits. Pricing does not multiply per account, and credential sharing disappears, while measurement and production stay available for every creator on the roster.
The framework above points to the same conclusion: measurement alone does not solve growth. You need tools that also help you act on what the numbers reveal.
Go viral today and get started with Sozee.
Frequently Asked Questions
Is AI-Generated Content Realistic Enough For OnlyFans?
Hyper-realism functions as the baseline requirement, not a bonus feature. Sozee’s core principle is hyper-realism or nothing, because content that fans can identify as AI-generated becomes operationally useless. Sozee reconstructs a creator’s likeness from as few as three photos and locks the same face and body across every frame, every set, and every week. The locked likeness separates a brand from a novelty by keeping identity consistent across a Photo Shoot set of up to ten images, across Live Mode sessions, and across video and reel clones. For creators who want total anonymity, Sozee can generate an entirely original AI character from scratch, a face that has never existed and remains consistent from the first frame. Fan detection risk is managed through realism rather than disclosure tricks.
How Much Effort Does Implementation Take?
Effort depends on the route you choose.
The API build-your-own path using onlyfansapi.com or onlyfansapi.app requires development work across authentication flows, endpoint integration, webhook handling, and dashboard construction. It does not function as a ready-made tool. Ready-made platforms like FansMetric and Supercreator require account connection and onboarding, with Supercreator recommending a seven-day chatter onboarding timeline before going live on active accounts.
Sozee requires three photos to lock a likeness and skips training, waiting, and technical setup. The Agent handles shoot setup conversationally for creators who prefer not to learn the controls directly. For agencies, workspace setup stays isolated per creator with its own characters, vault, connected accounts, and credits.
Is My Likeness Data Private?
Sozee’s privacy principle is explicit: your likeness belongs to you alone. Models stay private, isolated, and never train anything else. This operates as a structural commitment rather than a policy footnote. The same isolation that keeps each creator’s workspace independent in the agency Teams feature also applies to the underlying likeness model. No cross-creator training occurs, no shared model weights exist, and no external data use takes place. For creators focused on identity protection, this isolation forms the foundation of the product’s trust model.
Are Free Tools Enough?
For solo creators under roughly $10K/month, the free Statistics tab plus a spreadsheet often provides enough insight. This setup also avoids the credential-sharing risk that comes with connecting a third-party tool to your OnlyFans account. The native dashboard covers earnings by source, post-level performance, subscriber trends, and CSV export for trend analysis.
Paid tools add value when you run a team of chatters and need per-chatter attribution, send mass messages and need per-segment unlock data, or run PPV A/B tests at volume. Supercreator’s free CRM Lite tier covers multi-account CRM for up to 10 accounts with no AI features and offers a legitimate free option for small agencies. FansMetric’s free tier covers basic analytics for individuals, although neither free tier represents the full product.
Can I Track A Creator I Do Not Own?
You can track public data only.
OnlyFans public profile pages expose username, bio, post count, photo and video count, like count, fan count if the creator opted in, subscription price, and sometimes a last-online indicator. Earnings, churn, retention, and geographic data never appear on a public profile. Third-party profile checkers and scraper directories apply the same estimation methodology to everyone, which helps with benchmarking displayed subscription prices, bio patterns, and posting cadence but does not replace dashboard data.
Third-party earnings estimates can be off by 5x to 10x in either direction. Because scrapers cannot see PPV or tips, and subscription revenue is often under 30% of a page’s income, sub-price-times-subs estimates miss the majority of revenue on typical earning pages. Treat any published earnings figure for a creator you do not own as a directional guess rather than a measurement.
Ready to consolidate your stack? Create your Sozee account.
Read Next
- Social media analytics for creators turns reach, engagement, retention, and revenue data into clear posting decisions instead of passive dashboard views.
- Creators get better results when they focus on business-signal metrics such as engagement rate, watch time, shares, saves, and revenue per post instead of only tracking reach and impressions.
- A 30-minute weekly review that covers top and worst posts, hooks, formats, and timing works best when it ends with one written decision that shapes next week’s content.
- Revenue tracking through link clicks, leads, sales, and revenue per post shows which content types actually generate income and connects publishing to monetization.
- Native dashboards are enough for single-platform creators, while cross-platform creators need third-party tools for longer history, comparison, and workflow support.
Get started with Sozee to connect content creation, scheduling, and performance measurement so every weekly review turns into next week’s posts.
Social Media Analytics For Creators: The Metrics That Matter
Every metric below includes what it tells you and the action it supports. The split matters: the first group shows how far content traveled, and the second shows whether that content did anything for the business. When time is tight, review the second group first.
Vanity-Adjacent Metrics
- Reach. Meta’s developer documentation defines reach as the number of unique accounts that have seen your content at least once. It shows how widely a post traveled. If reach is high but engagement is low, the hook worked while the content failed to hold attention, so rewrite the body instead of the hook.
- Impressions. Total times content appeared on a screen, including repeat views from the same account. It shows how often the platform served the post. A high impressions-to-reach ratio means your existing audience is seeing the post repeatedly, which helps brand recall campaigns and can slow growth-focused ones. Note: Instagram deprecated the impressions metric and removed it from all API versions on 21 April 2025, and now uses views as the primary metric.
- Follower Growth Rate. Net new followers as a percentage of your starting count over a period. It shows whether content is converting viewers into an audience. When one post drives most of the new follows, replicate its format and topic. 2026 benchmarks put healthy monthly Instagram growth at 1%–4% for accounts in the 10k–100k range.
Business Signal Metrics
- Engagement Rate. Interactions divided by reach or followers, with a clear denominator chosen in advance. It shows how strongly the audience that saw the post responded. Posts with above-baseline engagement rate become templates to repeat, while posts below baseline become case studies for hook, format, or topic problems. SearchLab’s 2026 data classifies an Instagram engagement rate above 3% as excellent for creator accounts.
- Watch Time / Retention. Meta defines average watch time as the average amount of time spent playing a reel. This metric shows where viewers stopped caring. When you find the drop-off point, cut or restructure everything before that moment in the next video so more viewers reach the payoff.
- Shares and Saves. Shares signal content worth sending to someone else, and saves signal content worth returning to later. DM shares carry 3–5x more algorithmic weight than likes in Instagram’s 2026 ranking system, according to Metricool (April 2026). High saves point to educational or reference content you can expand into series, while high shares highlight emotionally resonant angles worth repeating.
- Profile Visits-to-Follows. The ratio of profile visits that convert to follows. This metric shows whether your grid and bio are doing their job. A low conversion rate means the profile does not match the promise of the post, so audit the bio, pinned content, and grid cohesion.
- Link Clicks. Clicks on the link in bio, story link, or any tracked URL. Because they measure off-platform intent, they form the first bridge between content and revenue. When one post drives a disproportionate share of clicks, build a content series around that topic or format.
- Revenue Per Post. Total revenue attributable to posts in a period divided by the number of posts. This metric shows which content type actually pays. Allocate more production time to the format and topic cluster with the highest revenue per post, even when it trails on vanity metrics.
The Weekly Review Ritual: 30 Minutes, One Decision
A weekly review works best as a fixed agenda that ends with one written decision for the coming week. Run it on the same day every week so patterns become easier to spot. Use this agenda as your baseline.
- Top 5 and Worst 5 Posts. Start by sorting posts by the metric that matters most to your current goal, such as reach for growth, engagement rate for depth, or link clicks for conversion. The goal of this step is to find the pattern the top five share, because that pattern becomes the input for every step that follows.
- Hook Analysis. For video, compare what happened in the first three seconds of your top performer and your worst performer. For text, compare the first lines. The hook determines whether anyone sees the rest of the content, so improvements here compound across every post.
- Format Analysis. Compare how reels, carousels, static images, or long-form videos performed that week. 2026 benchmark data shows Instagram carousels generate higher saves while Reels generate 36% more reach than carousels. Let your own data guide format choices instead of relying on platform folklore.
- Posting-Time Check. Review when your top-performing post went live versus your worst. Timing shapes who is online during the critical opening minutes. Instagram’s signal list includes recency as how old a post is, not the exact hour it went up, so treat timing as a supporting factor rather than the main lever.
- One Written Decision. End every review with a single sentence: “Next week I will ___.” Change one variable at a time so you can see which adjustment moved the numbers.
How Often Should Creators Check Their Analytics?
Check weekly for decisions and daily only for comments and DMs. TikTok’s algorithm often takes 48–72 hours to fully push a video, so a post that looks dead on day one can break out on day three. Weekly reviews support pattern recognition, while constant refreshes mostly create anxiety.
Platform Notes: Instagram, TikTok, YouTube
The weekly ritual works on any platform, but the metrics inside it differ. Each platform surfaces its own signals and defines them in specific ways, so the same review agenda produces different decisions depending on where you publish.
Instagram reorganized Insights into three tabs, Overview, Engagement, and Audience, in April 2026, adding views over time, share rate, and skip rate for Reels. The three metrics that drive decisions on Instagram are saves, shares, and profile visits-to-follows. Saves show whether content has reference value, so high saves justify more educational carousels. Shares, which Instagram’s API labels while Adam Mosseri called “sends” a top ranking signal in January 2025, show whether content is emotionally resonant enough to forward. Profile visits-to-follows show whether your grid converts curiosity into audience.
TikTok
TikTok analytics live in TikTok Studio, available in-app, as a standalone app, and on desktop, with the desktop version recommended for reading retention graphs. The two metrics that drive decisions on TikTok are average watch time relative to video length and completion rate. If a 30-second video has an average watch time of 8 seconds, most viewers left by the first third, which points to a hook or pacing problem. Completion rate is TikTok’s strongest quality signal, but compare it only against videos of similar length. ViralDeck’s 2026 benchmarks report TikTok median video completion rates of 52% for videos under 15 seconds and 34% for 15–30 seconds.
YouTube
YouTube Analytics organizes reports into Overview, Content, Reach, Engagement, Audience, Revenue, and Trends so creators can combine discovery, retention, and audience-fit metrics in one workflow. The two metrics that drive decisions on YouTube are audience retention and click-through rate, or CTR. YouTube defines thumbnail impressions click-through rate as how often viewers watched a video after seeing a thumbnail. A low CTR means the thumbnail or title fails before the content gets a chance, while a low retention curve means the content loses viewers after the click. Fix the click problem first, then the retention problem.
Platform documentation explains what each metric means. Creator communities add another layer in the form of folk rules about posting, and those rules often end up inside analytics rituals. Knowing which of these rules are platform guidance and which are practitioner heuristics matters before you build them into your system.
The Instagram Rule Folklore, Answered Honestly
Platform documentation tells you what the metrics mean, but it rarely tells you how to act on them. Creator communities fill that gap with rules of thumb. Some of these rules help new creators get started, while others become myths when treated as hard laws. Use the breakdowns below to decide which ones belong in your workflow.
What Is the 5-5-5 Rule for Social Media?
The 5-5-5 rule is an engagement guideline that suggests spending time liking, commenting, and sharing others’ content before expecting strong results from your own posts. It reflects practitioner advice about participation rather than a platform-published requirement. HubSpot’s 2026 social media myths guide presents it as a heuristic for community building rather than algorithmic validation. Verdict: helpful as a mindset for new accounts building relationships, and less relevant as a ranking strategy once your own engagement data shows what your audience responds to.
What Is the 4-1-1 Rule on Instagram?
The 4-1-1 rule was coined by Andrew Davis at Tippingpoint Labs and popularized by Joe Pulizzi at the Content Marketing Institute, which gives it content-marketing origins rather than Instagram platform roots. For every six posts, four deliver value through education, entertainment, or how-to content, one shows something personal or behind the scenes, and one promotes directly. Joe Pulizzi himself said: “The numbers don’t have to be exact. It’s the idea: most of the time you’re sharing content that isn’t [purely] yours.” Verdict: a reasonable starting framework for creators without content mix data. Treat it as a temporary guide until your own retention data shows which formats and topics hold attention.
What Is the 80/20 Rule for Social Media?
The 80/20 rule states that 80% of content should inform, educate, or entertain while 20% directly promotes. theStacc’s glossary presents it as a marketer-created starting framework, not official platform guidance, and notes that no claim is made that Instagram or any platform published or endorsed the ratio. Akshay VR, Marketing Head at theStacc, writes that the content-mix ratio is “a planning constraint, not a rule the audience can see,” and that creators should trust their own engagement data over the industry rule. Verdict: directionally sound as a starting point. Treat the ratio as a planning constraint, and let your save rate, share rate, and revenue per post decide which mix you keep.
What Is the 3-7-27 Rule?
The 3-7-27 rule is a relationship-building framework sometimes cited in creator circles. It holds that roughly three interactions are needed to be recognized, seven to be remembered, and 27 to build trust. The idea comes from sales and relationship psychology rather than platform documentation. Instagram operates separate ranking systems per surface, Feed, Stories, Explore, and Reels, each with its own signal weighting, and none of those systems reference interaction counts of this kind. Verdict: a useful mental model for thinking about audience depth over time, but not a posting strategy. Your retention curve and DM volume are better signals of trust than any fixed interaction count.
The Revenue Layer Nobody Covers
Reach and engagement measure how content travels, and revenue measures what that content produces. The metrics that connect them are link clicks, leads, sales, and revenue per post, which we defined earlier as total revenue divided by posts published. Almost no analytics guide explains how to track these steps in a simple workflow.
Start by UTM-tagging every link in bio and story, because link clicks are the earliest signal that a post is driving off-platform intent. From there, count form fills, DM inquiries, or email sign-ups attributable to specific posts to see which content produces leads. Match purchase timestamps to post dates, or use affiliate links, to connect leads to actual sales. Divide total revenue in a period by posts published, and you have revenue per post, which is the most honest measure of whether a platform is worth your time.
Does Instagram Pay You Per 1,000 Views?
Most creators earn little or nothing per 1,000 views from Instagram itself. There is no ad revenue share on regular Reels or posts in 2026, and the old Reels Play Bonus was shut down in 2023, so the realistic per-1,000-views value from Instagram itself is $0 for most creators. For the small pool of creators invited into Instagram’s Reels ad revenue sharing program, US creators consistently report effective earnings of $0.01 to $0.05 per 1,000 views. For creators under 100K followers, brand deals account for 80 to 95 percent of their Instagram income. The real revenue layer comes from sponsorships, subscriptions, affiliate commissions, and direct product sales, all driven by engagement quality and audience trust rather than raw view counts. TikTok’s Creator Rewards Program pays an average of $0.40 to $1.00 per 1,000 qualified views for eligible creators, which creates a different monetization environment than Instagram, but even there, brand deals and affiliate income usually dwarf platform payouts at the micro-creator tier.
Native vs. Third-Party Tools, and Where Sozee Fits
Once you know which metrics matter and how to review them, the next decision is where to read them. Native dashboards, Instagram Insights, TikTok Analytics via TikTok Studio, and YouTube Studio Analytics, are free, platform-accurate, and sufficient for single-platform creators running a weekly review. Their limits are real. TikTok Studio provides only 60 days of historical data. Instagram Insights offers within-platform comparisons, such as comparing content types or time periods, but no cross-platform comparison, which requires a third-party tool. None of the native dashboards show what your publishing tool contributes to your results.
Third-party tools extend historical data, aggregate platforms, and add scheduling. For a comparison of the leading options, see the 10 Best Social Media Analytics Tools for Creator Agencies and 7 Multi-Platform Creator Analytics Tools That Save Hours guides.
Sozee is the AI Content Studio for the Creator Economy, and it is built to close the loop between making content and measuring it. Its Scheduler connects Instagram, TikTok, X, Facebook, Reddit, and Fanvue per character rather than per account. Its Analytics splits performance between what Sozee posted and what you posted, so you can see exactly what the platform is worth. Its Agent reads your characters, your library, and your performance, then writes the caption and schedules the post so the weekly review ends in action instead of another spreadsheet.
Start creating now, and let Sozee turn your weekly review into next week’s content.
Frequently Asked Questions
How to Track Social Media Analytics Across Platforms?
Start with each platform’s native dashboard, since Instagram Insights, TikTok Studio, and YouTube Studio Analytics are free and accurate. For cross-platform tracking, use a third-party tool that aggregates data into a single view. The most important step is standardizing your measurement formula before comparing results, because engagement rate calculated against followers produces a different number than the same metric calculated against reach. Pick one formula per platform and hold it constant across every weekly review.
What Should Creators Do If They Only Have 10 Minutes a Week for Analytics?
Focus on the single business-signal metric that matches your current goal, such as engagement rate for depth or link clicks for conversion. Sort posts from that week by that metric and study the top three and bottom three. Write one sentence about what the winners share and one sentence about what the losers share, then choose one change to test next week.
What Is the 5-3-2 Rule on Instagram?
The 5-3-2 rule is a content-mix framework: five curated posts from others, three original brand or creator posts, and two personal or humanizing posts out of every ten. It reflects practitioner advice designed to prevent over-promotion and build community, not a rule published or endorsed by Instagram or Meta, and it does not appear in any Instagram ranking documentation or signal list. Use it as a starting framework if you have no content mix data, and then let your own engagement-by-content-type data take over once you have enough posts to see patterns.
Conclusion: Analytics Is a Decision System, Not a Dashboard
Creators who win in 2026 use analytics as a decision system instead of a scorecard. They build a metric hierarchy that separates vanity from business signal, a 30-minute weekly ritual that ends in one written decision, and a revenue layer that connects posts to income rather than impressions to ego.
CreatorIQ’s State of Creators 2026 report found that only 1% of creators use AI to automate workflows, which leaves a wide gap between creators who treat analytics as a system and those who treat it as a dashboard. The metric hierarchy, the weekly ritual, and the revenue layer form that system. Sozee closes the loop by connecting what you publish to what it produces and by turning each review into the next set of posts.
Read Next
- Generic “best time to post” charts ignore your unique audience. TikTok’s follower activity data gives you reliable timing signals.
- Use the Follower Activity graph in TikTok Studio to find the exact hours and days when your followers are most active.
- Schedule posts 15–30 minutes before those peaks so early engagement builds before most of your audience opens the app.
- Run a 3–4 week test while holding content quality steady, then judge the schedule using 24-hour views, watch time, shares, and follower growth.
- Sozee’s Scheduler and Analytics connect TikTok, Instagram, X, Facebook, Reddit, and Fanvue so you can run a data-driven schedule and track results in one place. Try Sozee free and connect your channels.
How Tiktok Analytics Determine Your Posting Schedule
Tiktok analytics determine your posting schedule by showing when your followers are active on the app. When you review the Follower Activity graph in Tiktok Studio, you can spot peak hours and days, then schedule posts 15–30 minutes before those peaks so your content builds engagement momentum as your audience logs on.
The workflow in full:
- Find your Follower Activity data in Tiktok Studio.
- Identify peak hours and days for your specific audience.
- Apply the 15–30 minute pre-peak posting rule.
- Run a 3–4 week posting test to validate your schedule.
- Use analytics to decide posting frequency.
- Adjust posting times for different time zones.
- Match content type to time of day.
Prerequisites: What You Need Before You Start
Set up a few basics before you run this workflow:
- A Tiktok account with at least a few weeks of posting history.
- Access to Tiktok Studio on desktop or mobile. Switching to a Business or Creator account takes under two minutes via Settings and Privacy → Manage Account → Switch to Business Account.
- 3–4 weeks available for a testing cycle.
With those prerequisites in place, the next question is why timing matters at all. The answer lies in how Tiktok’s distribution pipeline works. Tiktok’s For You Page algorithm distributes new videos in waves: a video is first shown to a test audience, and if engagement metrics such as watch time, completion rate, likes, comments, and shares exceed thresholds, it is pushed to a larger audience (though Tiktok does not publish the exact test-audience size). Posting at the wrong time suppresses that initial velocity. Tiktok’s strongest published weighting statement says a strong indicator of interest, such as whether a user finishes watching a longer video from beginning to end, receives greater weight than a weak indicator. Timing your post to align with peak audience activity gives your content a better chance of generating those early signals before the initial distribution window closes.
Step 1: Find Your Follower Activity Data In Tiktok Studio
On desktop, follow this path: Tiktok Studio → Analytics → Followers tab → Follower Activity.
On mobile, open your Tiktok profile, select Tiktok Studio below your bio, tap Analytics, then open the Followers tab.
Tiktok Studio’s Followers tab includes a Follower Activity graph that displays when followers were most active by hour and day over the past week. The data appears in your account’s time zone. This is the most important screen for scheduling decisions, and it updates as your audience grows and changes.
Accounts with 100 or more followers can use the Followers tab for follower-specific activity data. If your account is newer than that threshold, use the Viewers tab’s Most Active Times data as a proxy while your follower base grows.
Step 2: Identify Peak Hours And Days For Your Audience
Use the Follower Activity graph to find your timing sweet spots:
- Scan for the highest bars across the hourly view.
- Note the top two or three hour blocks per day.
- Identify which days of the week show the strongest overall activity.
Assume your peaks differ from any generic chart. The best time to post on Tiktok varies by audience demographics and activity patterns, and personal data is the most reliable source, while general advice often points to evenings and weekends without accounting for your specific audience.
Expect peaks to shift as your follower base changes. A creator who built an audience through morning educational content may see early-riser peaks, while an entertainment account may see evening spikes. Repeat this step monthly to keep your schedule current.
Step 3: Apply The 15–30 Minute Pre-Peak Posting Rule
Once you identify your peak activity windows, schedule posts 15–30 minutes before the start of each window rather than at the peak itself.
Tiktok’s algorithm measures engagement within the first 30–60 minutes after posting, which makes peak-hour posting critical for strong early signals. Posting just before the peak gives your video time to accumulate initial watch time and engagement before the largest number of your followers open the app. When that peak arrives, the algorithm already has positive signals and is more likely to push the video to a wider audience.
Step 4: Test Posting Times With A 3–4 Week Schedule
Identifying peak hours creates a timing hypothesis. A 3–4 week test validates that hypothesis.
Design the test as follows:
- Pick two or three candidate time slots from your Follower Activity data.
- Post at those times consistently for 3–4 weeks, rotating through the slots.
- Hold content type, format, and quality as steady as possible. Changing multiple variables at once makes it impossible to isolate the timing effect.
To judge whether a slot is genuinely better, compare these metrics across slots. The strongest slot should show better 24-hour views and watch time, not just a single viral spike:
- Views at 1 hour, 24 hours, and 7 days per post.
- Average watch time and retention.
- Shares per post.
- Follower growth over the test period.
Saves and shares are stronger signals of content value than likes or comments. They show the audience found the content worth returning to or distributing, which sends a strong signal to Tiktok’s recommendation system. InfluencerDB advises requiring at least 6 posts per posting window before declaring a winner and warns against treating a single viral post as proof of a timing effect.
For Tiktok timing tests, reading results 48–72 hours after posting is recommended, because Tiktok’s algorithm distributes content to small test audiences first. Use the 24-hour view count as your primary comparison metric since it captures the critical initial distribution window. Then layer in watch time and shares for a complete picture.
Step 5: Decide How Often To Post Using Your Analytics
Posting frequency functions as a variable you set from your own performance data.
Use a simple rule: if average views per post drop as you increase volume, you are over-posting. If average views hold steady or rise, you can sustain or increase frequency. A Buffer analysis of 11.4 million posts from more than 150,000 accounts found that median views per post fell from 506 at 2–5 posts per week to 459 at 11 or more. The 90th percentile rose from 6,983 to 14,401. Posting more widened the upside tail but did not lift the typical post.
Creators usually ask about specific posting frequencies. Here are the most common ones and how to approach them:
- Is 3x/day good? Only if your analytics show average views per post holding steady at that volume. Posting more than a few times per day can dilute performance, and a single bad video can drag down average results if watch time drops.
- Is 2x/day too much? Volume works only when posts do not compete with each other. Posting two Tiktok videos within an hour of each other causes them to compete for the same initial follower test batch, resulting in weaker distribution for both. Space multiple daily posts at least 3–4 hours apart.
- How many times per week? Buffer’s analysis of 11.4 million Tiktok posts found that posting 2 to 5 times per week produces the most meaningful improvement in views relative to effort, with returns diminishing noticeably beyond 5 posts per week. Stackmatix’s 2026 TikTok posting frequency playbook states that solo founders or small teams often start at 2 to 3 posts per week and scale up as their production system matures, while most brands see the best results posting 3 to 5 times per week. Your own analytics override generic guidance as soon as you have enough data.
Executing a data-driven schedule consistently creates the real advantage. Sozee’s Scheduler lets you publish to Tiktok, Instagram, X, Facebook, Reddit, and Fanvue from one place, with a live preview of the real post before it goes out. Sozee’s Analytics shows impressions, reach, likes, comments, shares, and engagement, plus a split between what Sozee posted and what you posted directly, so you can see exactly what the platform contributed to your results. Plan your TikTok posting calendar with Sozee.
Step 6: Adjust Posting Times For Different Time Zones
Your Follower Activity data shows when followers are active, but it does not reveal their locations. For that, use Tiktok Studio’s Top Territories data.
Follow this path: Tiktok Studio → Analytics → Followers tab → Top Territories. This section shows the countries and cities where your followers are concentrated.
Tiktok shows times in UTC in some analytics views, so creators must convert to their audience’s local time zone before making scheduling decisions. Tiktok automatically uses the creator’s local time zone when scheduling posts, which creates a mismatch if your audience is in a different region.
Use this practical method for multi-region audiences:
- If 70% or more of your views come from a single market, schedule for that market’s time zone.
- When views are split across regions, consider posting twice daily, once for each primary time zone cluster, rather than relying on a single universal slot.
- For a US East Coast and UK split, posting around 8–10 a.m. EST covers early afternoon in the UK and morning in the US, which works for both groups even if it is not perfect for either.
- Creators targeting a time zone 6+ hours ahead of their own should use a scheduling tool rather than setting an alarm for 2 a.m.
Use Tiktok Studio’s Content tab to validate whether a time-zone adjustment works. Filter top-performing posts and review where traffic sources originate. If the adjustment is correct, you will see stronger early engagement from the target region.
Step 7: Match Content Type To Time Of Day
Audience online and audience ready are different states. People may scroll at lunch but only watch long videos later at night. That distinction is why content type should determine which peak window you target, even if it is not the hour with the tallest bar.
Entertainment content such as short, high-stimulation videos often performs best in evening leisure windows when audiences are winding down and browsing without a specific goal. Educational or how-to content can perform in morning or lunch windows when audiences are in a learning mindset. Niche-specific timing patterns include personal finance and career content leaning toward Tuesday–Thursday afternoons, motivation and quotes toward early morning, and story and entertainment toward evenings 7–11 p.m. local time.
Treat these patterns as starting hypotheses. Test them against your own analytics before committing to a content-type and time-slot pairing.
Common Pitfalls And Pro Tips For Tiktok Scheduling
Avoid these mistakes that consistently undermine scheduling experiments:
- Pitfall: Trusting generic best-time charts over your own Follower Activity data.
- Pitfall: Changing too many variables at once during a test. Content type, format, and posting time should not all shift simultaneously.
- Pitfall: Ignoring time zones and scheduling against your own local time when your audience is in a different region.
- Pitfall: Posting at peak instead of 15–30 minutes before peak, which leaves no runway for early signal accumulation.
- Pitfall: Over-posting and diluting average views per post below a sustainable baseline.
- Pitfall: Treating timing as the only variable. Timing adjustments deliver the most value once content already generates reasonable results. If videos consistently produce low watch time, changing the posting schedule will not fix that underlying problem.
Use these pro tips to compound gains over time:
- Pro Tip: Review your Follower Activity data monthly. Peaks shift as your audience grows and your content mix evolves.
- Pro Tip: Use a scheduler that connects to your analytics so you can see exactly what worked and close the loop between scheduling decisions and performance outcomes.
What Success Looks Like: Metrics To Track
A working posting schedule produces clear improvements across a consistent set of metrics. After a 3–4 week test, look for:
- Consistent or rising average views per post across your chosen time slots.
- Stable or improving average watch time and retention. Watch time remains one of Tiktok’s most important ranking signals, and completion rate often matters more than view count because it reflects genuine interest rather than a passive scroll-by.
- Growth in shares per post, which receive disproportionate algorithmic boost when videos are shared to external platforms or sent to friends.
- Follower growth over the test period as a lagging confirmation that the schedule connects with the right audience.
Avoid chasing likes as your primary scheduling signal. InfluencerDB distinguishes between availability windows, which are blocks when the audience is consistently active, and response windows, which are blocks where posts earn above-average saves, shares, or watch time, and argues that response is what matters.
Advanced Tips And Next Steps With Sozee
Once the 3–4 week test produces a clear winning window, build a monthly analytics review into your workflow. Creators should re-evaluate their timing strategy every 2–3 months because Tiktok’s algorithm changes frequently and audience behavior shifts seasonally. A schedule that works in September may need adjustment by January as your follower base grows and platform dynamics shift.
The next layer of improvement comes from connecting scheduling to analytics natively so the feedback loop closes automatically. Sozee’s Vault keeps every image, video, voice note, and Live Mode snap in folders you control, so the content you need is already organized when it is time to schedule. Every piece of content you create stays in one library and is ready to publish on the schedule your analytics support. Sozee’s Agent goes further by reading your characters, your library, and your performance data, then proposing and producing content based on what is working. “I need this week’s content” turns into a finished, scheduled plan, which represents the end state of the workflow this article teaches. Organize your TikTok content and schedule with Sozee.
Frequently Asked Questions
How Do I Find My Best Time To Post On Tiktok?
Open Tiktok Studio, go to Analytics, and select the Followers tab. The Follower Activity graph shows your peak hours and days. Schedule posts 15–30 minutes before those peaks so early engagement builds before most followers log on. See Step 1 for the full navigation path.
Does Tiktok Analytics Show Follower Activity?
Yes. Tiktok Studio’s Followers tab includes a Follower Activity graph that shows when your followers are active by hour and day. Accounts with 100 or more followers can access this follower-specific data. Accounts below that threshold can use the Viewers tab’s Most Active Times data as a proxy until the follower base grows enough to produce reliable Follower Activity readings.
How Often Should I Post On Tiktok?
Derive frequency from your own analytics instead of a fixed number. If average views per post drop as you increase volume, you are posting too often. If average views hold steady or rise, you can maintain or increase frequency. Stackmatix’s 2026 TikTok posting frequency playbook states that solo founders or small teams often start at 2 to 3 posts per week and scale up as their production system matures, while most brands see the best results posting 3 to 5 times per week. As the Buffer analysis cited in Step 5 shows, 2–5 posts per week delivers the best return for effort. Your own data overrides any generic recommendation once you see a pattern.
How Long Should I Test A Posting Schedule?
Run the 3–4 week test described in Step 4, keeping content type, format, and quality steady. Compare views at 24 hours, average watch time, retention, shares, and follower growth across the slots. Apply the same 6-post minimum per window mentioned in Step 4 before drawing conclusions, and read results 48–72 hours after each post to account for Tiktok’s staged distribution to test audiences.
Do Time Zones Matter For Tiktok Posting?
Yes. Check your audience’s top countries and cities in Tiktok Studio under the Followers tab’s Top Territories section. Tiktok displays times in UTC in some analytics views, so convert peak hours to your audience’s local time zone before building your schedule. If your audience is concentrated in one region, schedule for that region’s time zone. If your audience is split across two primary regions with no clean overlap, consider posting twice daily, once for each cluster.
What Metrics Matter Most For Scheduling Decisions?
Shares and watch time provide stronger signals than likes when you evaluate whether a posting window works. Track views at 1 hour, 24 hours, and 7 days; average watch time and retention; shares per post; and follower growth over the test period. Saves also matter. A post with fewer views but strong saves often outperforms a high-view, low-save video in long-term algorithmic reach.
Can I Schedule Tiktok Posts And See Analytics In One Place?
Yes. Sozee’s Scheduler connects Tiktok, Instagram, X, Facebook, Reddit, and Fanvue per character and supports photos, carousels, reels, and stories with a live preview of the real post. Sozee’s Analytics shows impressions, reach, likes, comments, shares, and engagement, plus a split between what Sozee posted and what you posted directly, so you can see exactly what the platform contributed to your results. Connect your TikTok scheduling and analytics in one place.
Conclusion: Build Your Schedule, Then Close The Loop
Guessing at posting times wastes your content’s potential. Every video you publish enters a distribution race in the first 30–60 minutes after posting, and that race is easier to win when your audience is already active and scrolling.
Tiktok analytics provide the source of truth for your personalized schedule. The seven-step workflow in this guide gives you a repeatable process for finding your Follower Activity data in Tiktok Studio, identifying your peak hours and days, applying the 15–30 minute pre-peak rule, running a 3–4 week validation test, setting posting frequency, adjusting for time zones, and matching content type to time of day based on your own data.
The workflow delivers results only when you execute it consistently. Sozee closes the loop by connecting scheduling and analytics in one place, so every post goes out at the right time and every result feeds into your next scheduling decision.
Ready to post on a schedule driven by your analytics instead of guesswork? Build your data-driven TikTok schedule with Sozee.
Read Next
- The TikTok Analytics API is a collection of routes. Developers choose between Display API, Business API, Research API, third-party scrapers, or open-source libraries based on data needs.
- Each official route has strict access requirements. Display API needs OAuth scopes, Business API requires advertiser approval, and Research API is limited to academic or non-profit applicants.
- Unofficial options such as third-party scrapers and open-source libraries provide faster access to public data but carry ToS risks, maintenance work, and possible GDPR obligations.
- The right route depends on whether you need your own account data, paid ads reporting, public research data, or competitor metrics. This guide maps each use case to a route.
- Skip custom integrations and use Sozee’s native TikTok analytics with a simple signup at Sozee’s signup page.
In-App Analytics Vs. Creator Analytics Vs. The TikTok Analytics API
TikTok provides three separate native analytics environments: in-app Analytics on mobile for Business Accounts, TikTok Business Center as a web-based access-control layer, and TikTok Ads Manager as the primary interface for paid campaign data.
TikTok’s native analytics dashboard is free for all accounts and covers views, likes, comments, shares, saves, watch time, traffic sources, and audience demographics. It only reports on your own account and keeps roughly 365 days of history.
The TikTok Analytics API exists because this data otherwise stays locked inside TikTok’s interfaces. It exposes a programmatic subset of the same metrics, controlled by OAuth scopes and the approval tier of each route.
If analytics are not visible in-app, the usual causes are a personal account without Creator or Business access through TikTok Studio or Business Suite, or a missing eligibility threshold. Examples include the 100-follower minimum TikTok’s API requires for Audience Analytics and higher thresholds such as 1,000 followers for full Creator Tools access.
Route 1: TikTok Display API
The Display API is TikTok’s official OAuth-based set of HTTP APIs that provides read-only access to display an authenticated TikTok creator’s profile information and videos through the /v2/user/info/, /v2/video/list/, and /v2/video/query/ endpoints. It returns data only for the account that granted authorization.
The two primary scope strings for TikTok Display API analytics are user.info.basic and video.list. The user.info.basic scope now returns only open_id, union_id, avatar_url, avatar_url_100, avatar_large_url, and display_name. Follower count and profile fields such as bio_description and is_verified moved to user.info.stats and user.info.profile. The video.list scope reads the authenticated user’s public videos on TikTok.
The following Python example fetches the authenticated user’s video list using a bearer token from the OAuth flow:
import requests ACCESS_TOKEN = "YOUR_BEARER_TOKEN" url = "https://open.tiktokapis.com/v2/video/list/" headers = {"Authorization": f"Bearer {ACCESS_TOKEN}"} params = { "fields": "id,title,view_count,like_count,comment_count,share_count,create_time" } response = requests.get(url, headers=headers, params=params) data = response.json() print(data) A trimmed successful response looks like:
{ "data": { "videos": [ { "id": "7123456789012345678", "title": "My latest video", "view_count": 48200, "like_count": 3100, "comment_count": 87, "share_count": 412, "create_time": 1720000000 } ], "cursor": 10, "has_more": true }, "error": { "code": "ok" } } Rate limits on the TikTok Display API are enforced per endpoint at the app level with a documented default of 600 requests per one-minute sliding window per endpoint. That ceiling matters less than the scope limit. The Display API cannot return competitor data, public trending data, or metrics for any account that has not explicitly authorized the app.
Route 2: TikTok Business API Reporting Endpoint
The Display API covers your own organic content but cannot report on paid campaigns. That gap is where the TikTok Business API, specifically its Marketing API, fits. This route provides programmatic access to paid ads reporting.
Access requires a TikTok for Business account, a registered developer app, OAuth 2.0 advertiser authorization, and passing TikTok’s app review and data-security compliance check. Sandbox access often takes only hours, while production approval usually takes days or weeks.
The reporting endpoint is /report/integrated/get/. It returns aggregated metrics such as spend, clicks, impressions, conversions, and derived ratios, broken down by dimensions like campaign, ad group, ad, country, and placement. Rate limits for the Reporting permission category are about 1 request per second per advertiser and about 600 requests per hour per app.
The following Python example calls the reporting endpoint with an access token:
import requests ACCESS_TOKEN = "YOUR_ACCESS_TOKEN" ADVERTISER_ID = "YOUR_ADVERTISER_ID" url = "https://business-api.tiktok.com/open_api/v1.3/report/integrated/get/" headers = {"Access-Token": ACCESS_TOKEN} payload = { "advertiser_id": ADVERTISER_ID, "report_type": "BASIC", "dimensions": ["campaign_id"], "metrics": ["spend", "impressions", "clicks", "conversions"], "start_date": "2026-08-01", "end_date": "2026-08-31", "page": 1, "page_size": 10 } response = requests.post(url, headers=headers, json=payload) print(response.json()) This route returns paid-ad performance data only. Organic content analytics live in TikTok’s separate Organic API surfaces such as Accounts, Mentions, Discovery, and Spark Ads Recommendation. A TikTok for Business account is required, and Verified Business Account status unlocks Conversion Analytics in addition to Basic Analytics.
Route 3: TikTok Research API
TikTok’s Research API is its official route for qualified researchers to access public data on TikTok content and accounts. It is also the most restricted route. Independent audits find that it provides only a partial, delayed, and selectively filtered subset of the platform’s public information environment, rather than the highest-fidelity data.
Access is limited to independent and academic researchers conducting research on a non-for-profit basis. Applicants submit an application, wait for approval, and must follow TikTok’s Community Guidelines and Research Tools Terms of Service. Most developers and commercial teams do not receive approval.
The Research API provides access to public Videos, Comments, and Accounts. Video data includes total likes, total comments, voice-to-text, subtitles, creation time, and video length. Comment data includes text, total likes, replies, and posting time. Account data includes bios, profile pictures, liked videos, and follower and following counts. Under the EU Digital Services Act, TikTok must also share certain data with researchers who hold Vetted Researcher status from a Digital Services Coordinator.
The following Python example queries the Research API video query endpoint:
import requests ACCESS_TOKEN = "YOUR_RESEARCH_API_TOKEN" url = "https://open.tiktokapis.com/v2/research/video/query/" headers = { "Authorization": f"Bearer {ACCESS_TOKEN}", "Content-Type": "application/json" } payload = { "query": { "and": [ {"field_name": "hashtag_name", "operation": "IN", "field_values": ["climatechange"]} ] }, "start_date": "20260801", "end_date": "20260831", "max_count": 10, "fields": "id,like_count,comment_count,share_count,create_time,hashtag_names" } response = requests.post(url, headers=headers, json=payload) print(response.json()) The Research API is rate-limited, requires academic affiliation, and excludes commercial use and specific countries. For developers and agencies working on commercial or product use cases, the Research API route is effectively unavailable because access requires Eligible Researcher status with an approved project application.
Route 4: Third-Party And Open-Source Alternatives
Two unofficial routes serve developers who cannot access the official APIs or need data the official APIs do not expose.
Third-party scraper APIs are commercial services that expose structured TikTok public data via REST endpoints. Depending on the provider, that data includes user profiles, engagement metrics, trending videos, hashtag analytics, and in some cases TikTok Shop data.
Documented limitations include no access to private data, no OAuth-free access to arbitrary users, incomplete TikTok Shop and live-stream coverage for some providers, and frequent outages or response-format changes, especially among RapidAPI TikTok providers with inconsistent data quality and no SLA guarantees. Third-party TikTok scrapers such as Apify’s TikTok Data Scraper require a paid subscription and no TikTok approval or account login, although some services like EnsembleData offer a free tier or trial.
Open-source libraries such as davidteather/TikTok-Api on GitHub simulate browser behavior to extract publicly visible data. These libraries often carry more than 100 open issues, which reflects the high maintenance burden caused by TikTok’s anti-bot system updates that break libraries on a regular cadence. TikTok’s open-source OpenSDKs for iOS and Android are publicly available, but integrating them still requires registering an app on the TikTok for Developers portal and obtaining a Client Key and Client Secret after application approval.
The following example shows a minimal call using the open-source TikTok-Api library:
import asyncio from TikTokApi import TikTokApi async def get_user_videos(username): async with TikTokApi() as api: await api.create_sessions(ms_tokens=["YOUR_MS_TOKEN"], num_sessions=1) user = api.user(username=username) async for video in user.videos(count=10): print(video.id, video.stats) asyncio.run(get_user_videos("example_user")) Documented constraints include read-only access, no authenticated routes, and bot-detection failures that appear as empty responses or exceptions and often require proxies. Open-source scraping remains operationally possible but rarely robust enough for unattended production use.
TikTok Analytics API Vs. Scraping: Access Reality
Many non-academic applicants see Research API applications rejected or delayed. When that happens, and when the Display API’s own-account-only scope does not cover the use case, developers usually choose between third-party scrapers and open-source libraries, each with clear tradeoffs.
TikTok’s Terms of Service, last updated May 5, 2026, prohibit users from using any automated system or software to scrape, crawl, export, or otherwise extract any data or content for any purpose unless TikTok approves it in writing. ToS violations can trigger account termination and breach-of-contract claims, while criminal liability under the CFAA usually requires more than a ToS breach under current US interpretations.
Which Route Should You Use?
The right route depends on what data you need and who owns the account. Use this framework to match developer goals to the appropriate route:
- Own account analytics (organic): Display API with
user.info.basicandvideo.listscopes. - Paid campaign reporting: Business API Marketing API with the
/report/integrated/get/endpoint, which requires an advertiser account and app review. - Public video and account data for academic research: Research API with an application at developers.tiktok.com, usually limited to academic or non-profit institutions.
- Competitor public metrics, trending data, hashtag analytics: Third-party scraper API with faster access, a paid subscription, and ToS and GDPR risk to evaluate.
- Custom scraping pipeline with full control: Open-source library with no subscription cost, high maintenance work, and fragile behavior when TikTok’s frontend changes.
- Analytics without building or maintaining any integration: Sozee’s native Analytics, described below.
See your TikTok metrics without writing a line of code.
Skip The Integration: Sozee’s Native TikTok Analytics
Every route above introduces overhead such as TikTok approval, OAuth token management, scraper maintenance, or ToS risk. If your goal is performance measurement rather than API engineering, that overhead may not justify a custom build. A platform with native analytics changes that calculation.
Sozee’s Analytics feature tracks impressions, reach, likes, comments, shares, and engagement. Its differentiator is the split between what Sozee posted and what the creator posted directly, which gives creators and agencies a clear view of how the platform contributes to performance without any API calls or OAuth grants.
The Scheduler connects TikTok alongside Instagram, X, Facebook, Reddit, and Fanvue on a per-character basis, so analytics tie directly to the content pipeline that produced them. The Vault feeds both the Scheduler and the Agent, which means every image, video, and voice note generated inside Sozee flows into scheduling and measurement without manual exports.
Sozee follows a complete studio loop of Cast, Direct, Create, Refine, Publish, and Learn. Analytics powers the Learn stage, where content performance feeds back into the next shoot setup. For agencies that manage multiple creators, Teams and Workspaces keep each client’s characters, vault, connected accounts, and credits fully isolated under one login.
The result is a platform that closes the loop between content creation and performance measurement. Creators and agencies gain the metrics while avoiding API approval queues, scraper breakage, and token lifecycle management.
Put your content pipeline and TikTok analytics under one login.
Frequently Asked Questions
Is The TikTok API Free?
TikTok does not currently charge subscription or per-call fees for Display, Business, or Research API access, although it reserves the right to introduce charges later. Approval gates access for each route. Third-party TikTok data APIs are commercial products with monthly subscription costs. The main constraint is approval and scope, not price.
How Do I Access The TikTok API?
Access steps depend on the surface you need. For the Display API, register a developer app at developers.tiktok.com, complete OAuth 2.0, and request the scopes your use case requires.
For the Business API Marketing API, register at the TikTok for Business developer portal at business-api.tiktok.com, complete OAuth advertiser authorization, and pass app review and a data-security compliance check before production access.
How Do I Export TikTok Analytics Data?
TikTok’s native analytics can be viewed in-app or in TikTok Business Suite, but raw data cannot be exported directly from the in-app interface. TikTok Ads Manager supports CSV exports for paid campaign data, with a limit of 200,000 rows per file.
For organic analytics, the Display API’s video.list endpoint returns per-video metrics programmatically for the authenticated account, including view, like, comment, and share counts when requested through the fields parameter. Creators and agencies that want scheduled exports without building an integration can rely on Sozee’s native Analytics and the Sozee-posted versus creator-posted split described above.
How Can I Extract Data From TikTok?
For your own account’s organic data, TikTok’s Display API is the official route, although it focuses on embedding videos and does not provide full metadata, search, or user data. For paid ads data, the Business API Marketing API reporting endpoint is the correct path.
For public data on other accounts such as competitor profiles, trending videos, and hashtag analytics, the Research API is the official route and carries the academic-only restriction described in Route 3. Outside those official routes, third-party scraper APIs and open-source libraries can extract publicly visible data but carry TikTok Terms of Service risk and ongoing maintenance needs as TikTok’s frontend changes. Platforms like Sozee provide native analytics for content posted through the platform, which removes the need to extract data directly.
What Is The Best TikTok Analytics Tool?
The best tool depends on your use case. TikTok’s native analytics is the source of truth for your own account and is free, with about a year of history and coverage limited to your own data. Third-party tools add competitor tracking, longer history, and client-ready reporting, but they cannot bypass TikTok’s API limits on your own account.
For creators and agencies that want analytics tied directly to content creation and scheduling, Sozee’s native Analytics and the Sozee-posted versus creator-posted split give a clear view of what works without any custom integration work.
Track every TikTok post’s performance in one dashboard.