
Key Takeaways
- Stan Store analytics tracks visits, product views, orders, conversion rate, revenue, and traffic sources within a selectable date range.
- Creators must connect dashboard numbers to specific actions, because traffic sources, conversion rates, and revenue by product each map to clear next steps.
- Creator Pro unlocks pixel integrations, affiliate analytics, email flow metrics, and course retention data that the base Creator plan does not provide.
- Discrepancies between Stan numbers and ad-platform pixels are normal, and monthly reconciliation with Stripe data reveals where tracking is failing.
- Sozee turns Stan Store analytics insights into scalable content production without increasing creator workload.
Turn Your Stan Analytics Into Content That Scales
Map Of The Stan Store Dashboard Analytics Tab
Reach the Analytics tab by logging into your Stan Store account and clicking Analytics in the left sidebar. The tab displays store visits, product views, order count, conversion rate, and revenue, all filtered by a selected date range.
The default date range Stan applies is 14 days. This single setting is the most common source of “my analytics look wrong” confusion. A creator who made three sales last week and checks the dashboard on day 15 may see those sales fall outside the window entirely. To set a custom range, use the date-range selector at the top of the Analytics tab and choose any start and end date. Every metric on screen recalculates to match the range you select.
Before reading any number on the dashboard, confirm the date range is set to the period you actually want to measure. Every metric below assumes that range is correct, and a wrong range describes a different business than the one you are trying to run.
The Four Native Metric Families
Traffic Sources
Traffic sources show where store visits originated. Stan’s base dashboard identifies the referrer host for each visit, so you can see whether traffic came from a direct link, a social referral, or another source. Three numbers tell the story:
- Visitor count — total unique visits to your store in the selected period
- Traffic source breakdown — referrer hosts grouped by origin
- Link clicks — which links on your bio page received clicks
Organic clicks from social posts, DMs, and Stories are not labeled by platform inside Stan’s dashboard, so you see the visit, not the social network that sent it. If a traffic source looks wrong or flat, add UTM parameters to every link you share and read them in an external tool. Action: audit your top three traffic sources against the content you posted in the same window and confirm the referrer pattern matches your posting cadence.
Conversion Rates
The Stan Store conversion rate is the percentage of store visits that result in a completed order within the selected date range. Stan surfaces conversion rate per product, so you can identify which products convert cleanly and which collect views without generating sales.
A drop in conversion rate typically signals one of three things. The traffic quality changed, the offer changed, or the page changed. No numeric benchmark appears here because conversion rate varies by product type, price point, and audience temperature. Action: sort products by conversion rate, identify the lowest performer with meaningful traffic, and treat it as a diagnostic rather than a write-off.
Income Tracking
Stan reports total revenue and revenue by product, filtered by the date range you select. Three core income metrics matter most:
- Total revenue — gross sales in the selected period
- Revenue by product — which products generated income and how much
- Order count — number of completed transactions
Stan does not report revenue by the social platform that drove the visit. If income looks lower than expected, cross-reference order count against product views. A high view count with low order count signals a conversion problem rather than a traffic problem. Action: compare revenue by product against the previous equivalent period to identify which product is growing and which is stalling.
Customer Insights
Stan’s Customers tab displays each customer’s name, email, customer tenure, number of purchases, and lifetime spend, and allows tagging for segmentation. These fields give you a simple customer model:
- Customer name and email
- Customer tenure — how long they have been a buyer
- Number of purchases — total transactions per customer
- Lifetime spend — cumulative revenue per customer
A segment of customers with high tenure but low lifetime spend is loyal yet under-monetized. That group is a strong candidate for an upsell sequence or a new product announcement. Action: tag your top ten customers by lifetime spend and treat that segment as your product-feedback panel before your next launch.
The Creator Pro Analytics Layer And Pixel Setup
Those four metric families are what every Stan creator sees by default. The picture changes once you upgrade, because the most actionable data that connects ad spend to revenue sits behind a paywall.
The Creator plan ($29/month) includes store and product analytics such as visits, views, orders, conversion rate, revenue, and customer data. Creator Pro ($99/month) adds Google Analytics, Meta Pixel, TikTok Pixel, and Pinterest integrations and is the only tier that fires the PageView, Purchase, and Lead pixel events to those platforms. It also unlocks affiliate analytics, email flow metrics, and advanced course tracking.
The upgrade decision stays simple. If you are running paid traffic and cannot connect your ad spend to your Stan revenue, you are optimizing blind. Because pixel tracking is gated to Creator Pro, creators on the $29 Creator plan can run ads but cannot measure them, so Meta reports clicks and Stan reports sales with nothing connecting the two data sets.
How To Add A Meta Pixel To Your Stan Store
Adding a Meta Pixel to your Stan Store requires a Creator Pro account. Follow these steps:
- Log into your Stan Store dashboard and navigate to Settings.
- Select the Integrations or Pixels section within Settings.
- Locate the Meta Pixel field and enter your Pixel ID. Your Meta Pixel ID is found in Meta Events Manager under your pixel’s Settings tab, where the field is now labeled “Dataset ID” (the number itself is unchanged). It also appears in your Pixel base code in the fbq(‘init’) line and the noscript image tag.
- Save the integration. Stan will begin firing PageView, Purchase, and Lead events to your Meta Pixel automatically.
Stan Store’s Settings tab (Profile > Analytics section) contains fields for a Google Analytics ID, TikTok Pixel ID, and Pinterest Claim Tag ID, but this feature is only available on the Creator Pro plan. All four tracking integrations Stan supports are browser pixels, so they fire in the visitor’s browser and are subject to ad blockers, Safari and Firefox tracking prevention, and declined consent.
Action: after adding your pixel, make a test purchase and verify the Purchase event appears in Meta Events Manager’s Test Events tool before running any paid campaign.
Track Paid Traffic And See What Actually Sells
How To Track Affiliate Sales In Stan Store
Affiliate analytics in Stan Store are a Creator Pro feature. Stan’s Affiliate Analytics tab shows top affiliate performers and lets creators refine commission strategy. The metrics available inside affiliate analytics include:
- Affiliate-driven sales — orders attributed to each affiliate’s unique link
- Commissions earned — the dollar amount owed to each affiliate per the commission rate you set
- Individual affiliate performance — which affiliates are generating traffic and which are generating conversions
- Payout status — commissions due and processed
The list above separates traffic from conversions for a reason. An affiliate who sends high traffic with low conversions is either reaching the wrong audience or linking to a product that does not match their content. An affiliate with low traffic but high conversion rate is a high-quality referrer worth nurturing. Action: sort affiliates by conversion rate rather than by raw traffic volume, and prioritize the relationship with your top converters.
Stan Store AutoDM Analytics Explained
Stan Store’s AutoDM feature is included in all plans at no additional charge and automates Instagram direct messages when a follower comments a chosen keyword, replies to a Story, or messages the creator directly. The analytics AutoDM produces include:
- Messages sent — total DMs dispatched by the automation in the selected period
- Opens — how many recipients opened the DM
- Link clicks — how many recipients clicked the product link inside the DM
A high send count with low link clicks indicates the DM copy is not compelling enough to drive action, or the product linked does not match the intent of the keyword that triggered the message. A high click count with low resulting purchases points to a product page problem rather than an AutoDM problem. Action: if link clicks are strong but purchases are not, focus your fixes on the Stan product page instead of the AutoDM sequence.
Stan Store Email Flow Metrics (Opens, Clicks, CTR, CTOR)
Stan Store’s email flow analytics view displays delivered emails, opens, clicks, click-through rate, and bounces across any date range the creator selects, and is accessed by clicking the analytics icon next to any Flow in the Email Flows tab. For Broadcasts, sends, opens, and clicks are trackable after sending. The full metric set for flows and broadcasts includes:
- Delivered — emails that reached the recipient’s inbox
- Opens — recipients who opened the email
- Clicks — recipients who clicked a link inside the email
- Click-through rate (CTR) — clicks divided by delivered emails
- Click-to-open rate (CTOR) — clicks divided by opens, measuring how compelling the email body is to those who opened it
- Bounces — emails that failed to deliver
A low open rate is a subject line and sender reputation problem. A low CTOR with a healthy open rate means the email body or offer is not converting readers who were interested enough to open. Action: if CTOR is low, rewrite the primary CTA inside the email before changing anything else, because that edit usually moves results fastest.
Stan Store Course Analytics: Retention And Completion Rate
Stan Store’s course analytics report retention, users, completion rate, and lessons completed, letting creators monitor how far learners progress and where drop-off occurs. The metrics inside course analytics include:
- Users — total enrolled students in the selected period
- Retention — the proportion of students who continue engaging with the course over time
- Completion rate — the percentage of enrolled students who finish the course
- Lessons completed — granular progress data showing which lessons students finish
Stan’s course builder supports drip-scheduled module release, and creators can toggle on automated emails that pull students back in once a drip window passes. When completion rate is low, check lessons-completed data for the specific lesson where drop-off spikes. That lesson is either too long, too dense, or positioned incorrectly in the sequence. Action: if completion rate is below your target, shorten the lesson at the drop-off point before restructuring the entire course.
Reconciliation: Why Stan And Your Pixels Disagree
Native Stan Store numbers and Meta or TikTok pixel numbers will never match exactly. This divergence is a structural feature of how browser-based tracking works. Meta, Stan, and a creator’s bank will each report a different purchase count.
At $2,000 per month in ad spend, that discrepancy is tolerable. At $40,000 per month, it represents misallocated budget, because the ad platform optimizes toward whatever data reaches it.
The documented causes of divergence include:
- Apple’s iOS 14.5 App Tracking Transparency caused Meta pixels to start missing 30–40% of mobile conversions when users decline tracking
- Safari’s Intelligent Tracking Prevention automatically blocks third-party cookies and limits first-party cookies to seven days, so a purchase made nine days after an ad click appears unattributed
- View-through conversions are counted by Meta when someone saw an ad without clicking and converted within 24 hours, but Google Analytics cannot track ad impressions, only clicks, so the conversion appears in Meta but not in GA4
- All four tracking integrations Stan supports are browser pixels subject to ad blockers and browser privacy settings
A practical reconciliation method is a monthly three-number check: pull Stan revenue for the last 30 days, Stripe gross volume for the same 30 days, and the ad platform’s reported purchase value for the same 30 days. Stan and Stripe should be close, with differences explained by refunds and timing. An ad platform reporting significantly below Stripe signals the gap you have been unknowingly optimizing against.
Stan Store Analytics Vs Google Analytics
Stan’s native analytics are optimized for the funnel from store visit to product view to sale. Google Analytics is deeper on session behavior and multi-touch path analysis, and it tracks how visitors move across pages and channels.
Both tools stop at the click for organic traffic without UTM tagging, so you still need tagged links for clean attribution. The practical rule: trust Stan for revenue and order counts, because it has the transaction record. Trust Google Analytics for session behavior and multi-touch paths, and treat ad platform numbers as directional signals rather than ground truth.
Action: run the three-number reconciliation monthly. When Stan and Stripe diverge by more than a rounding difference, investigate refunds and timing. When your ad platform diverges significantly from Stripe, your pixel is losing data and your campaign optimization is working from an incomplete signal.
Sozee: The Production Layer That Acts On What Stan Store Analytics Reveals
Reconciliation tells you which numbers to trust. Perfectly reconciled data still only describes what already happened, and acting on it means producing more of what worked.
Once Stan Store analytics shows which content converts and which traffic source sends buyers, the bottleneck shifts. The data says post more, while your schedule is already full. Sozee.ai is the AI Content Studio for the Creator Economy and breaks the link between a creator’s physical availability and their ability to produce content.
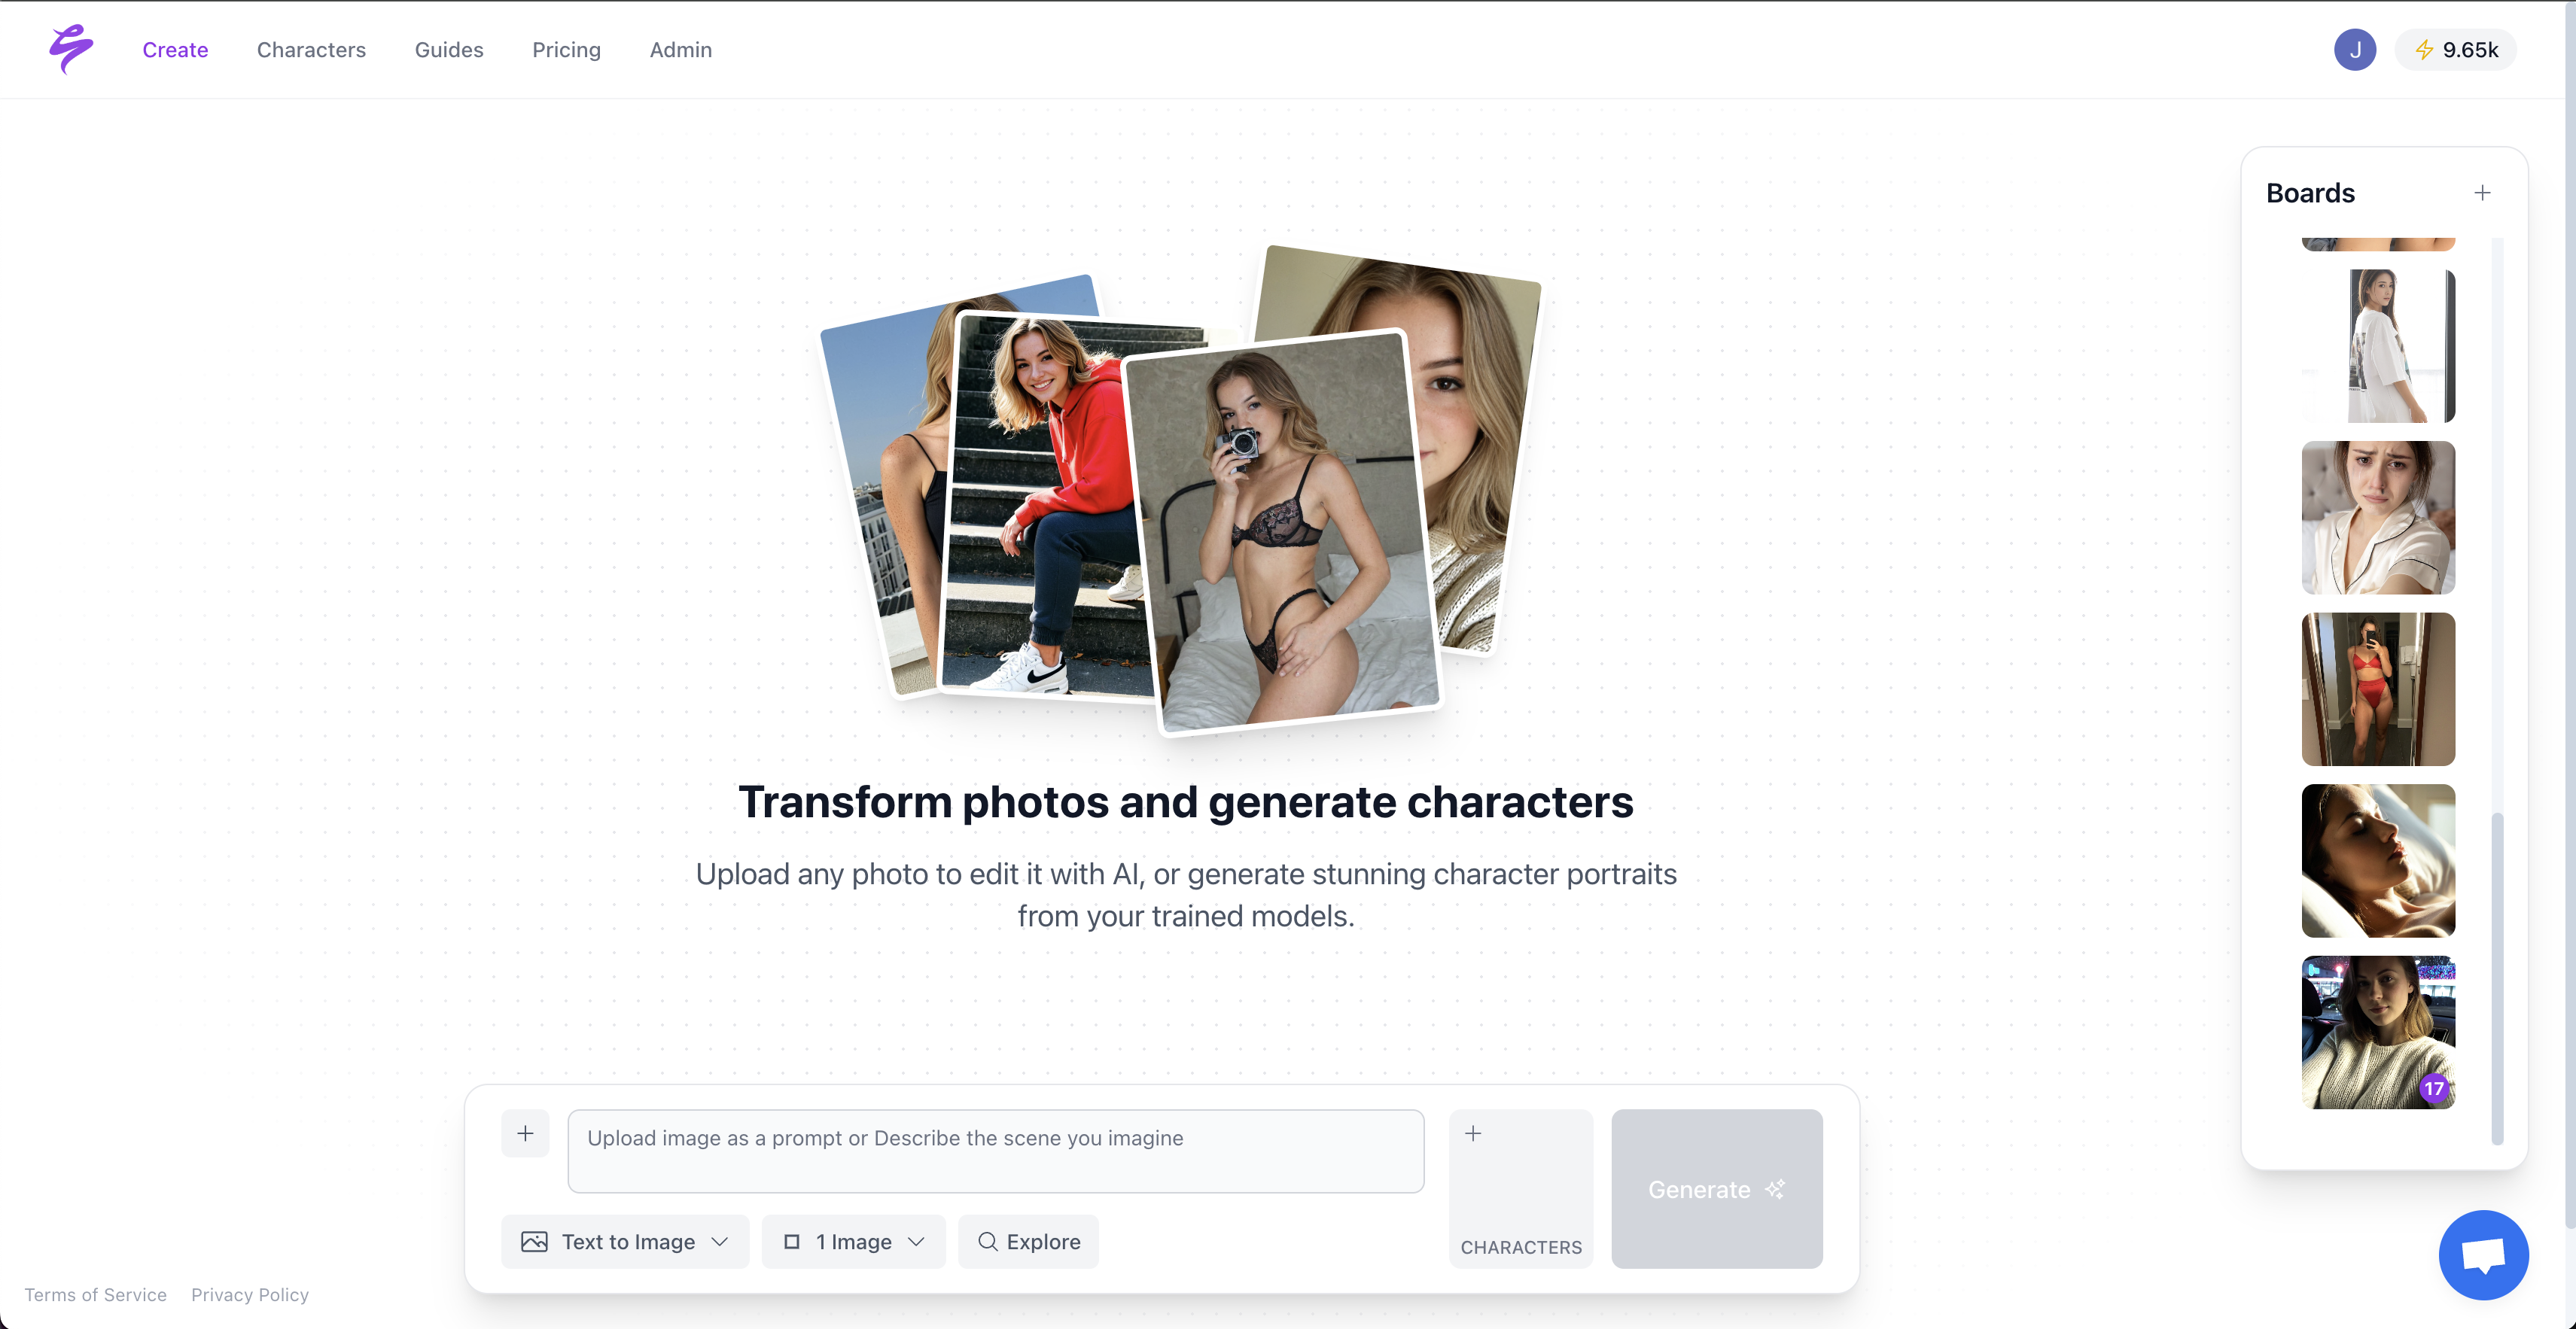
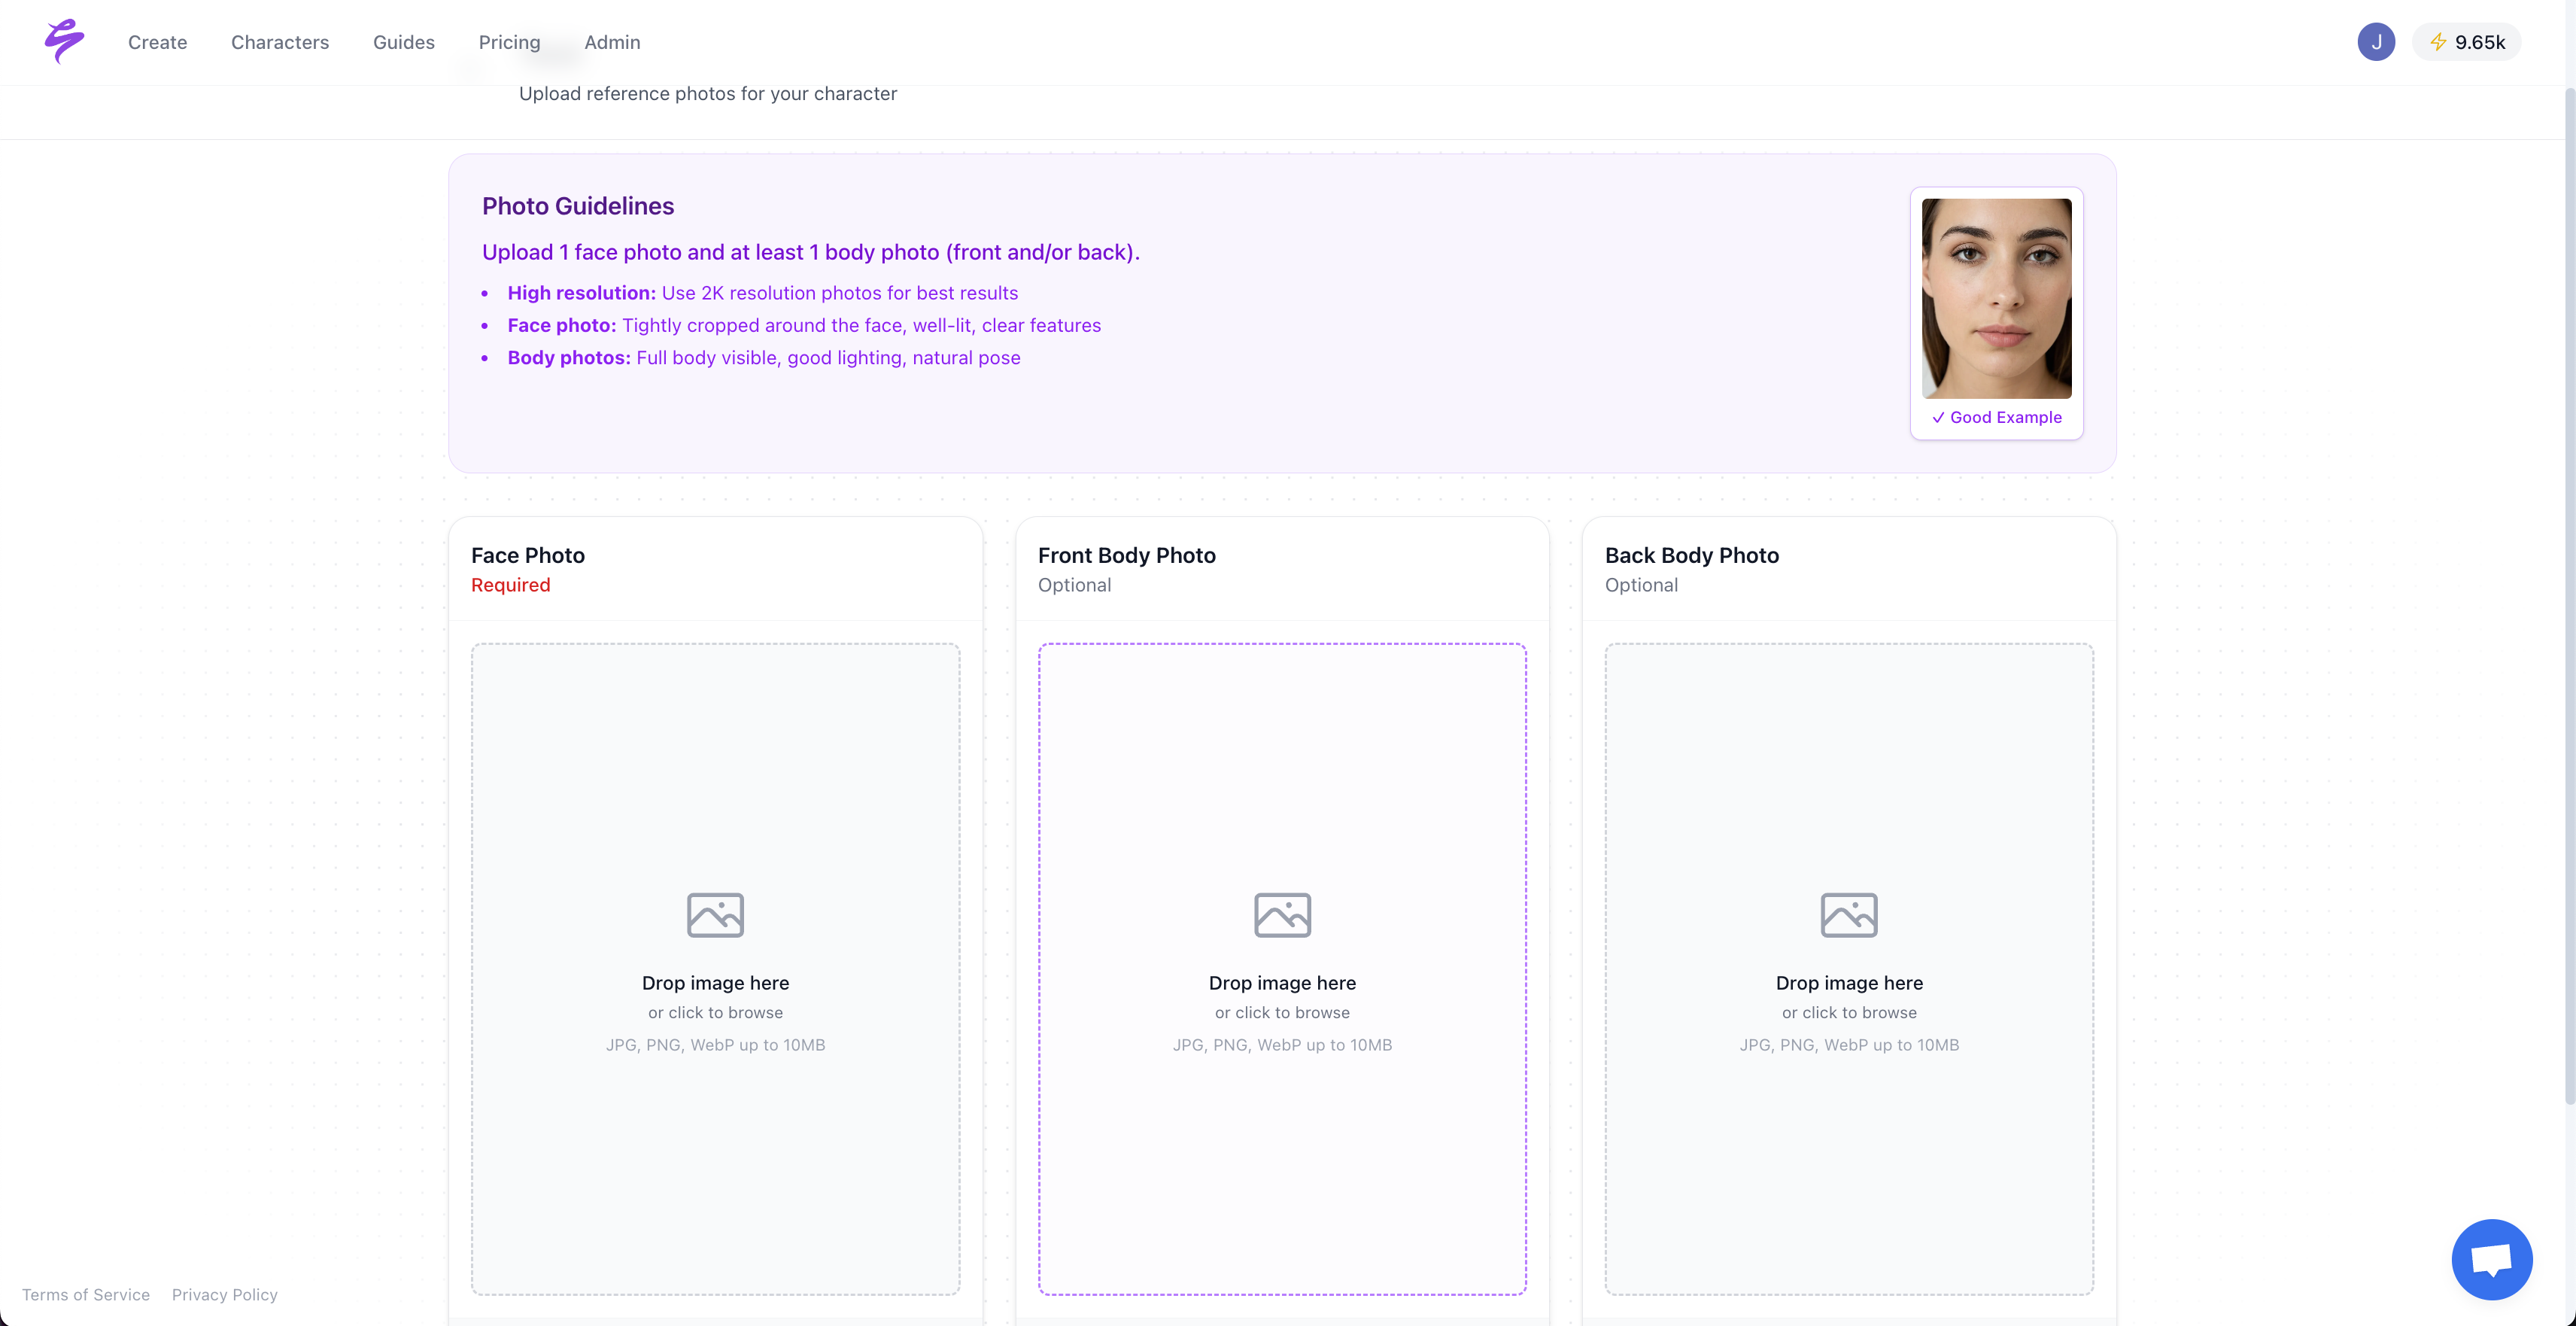
Upload as few as three photos and Sozee locks your likeness with hyper-realistic accuracy. From there, you direct rather than prompt. Photo Control gives you five dimensions to set deliberately: Setting, Outfit, Shot style, Expression, and Object.
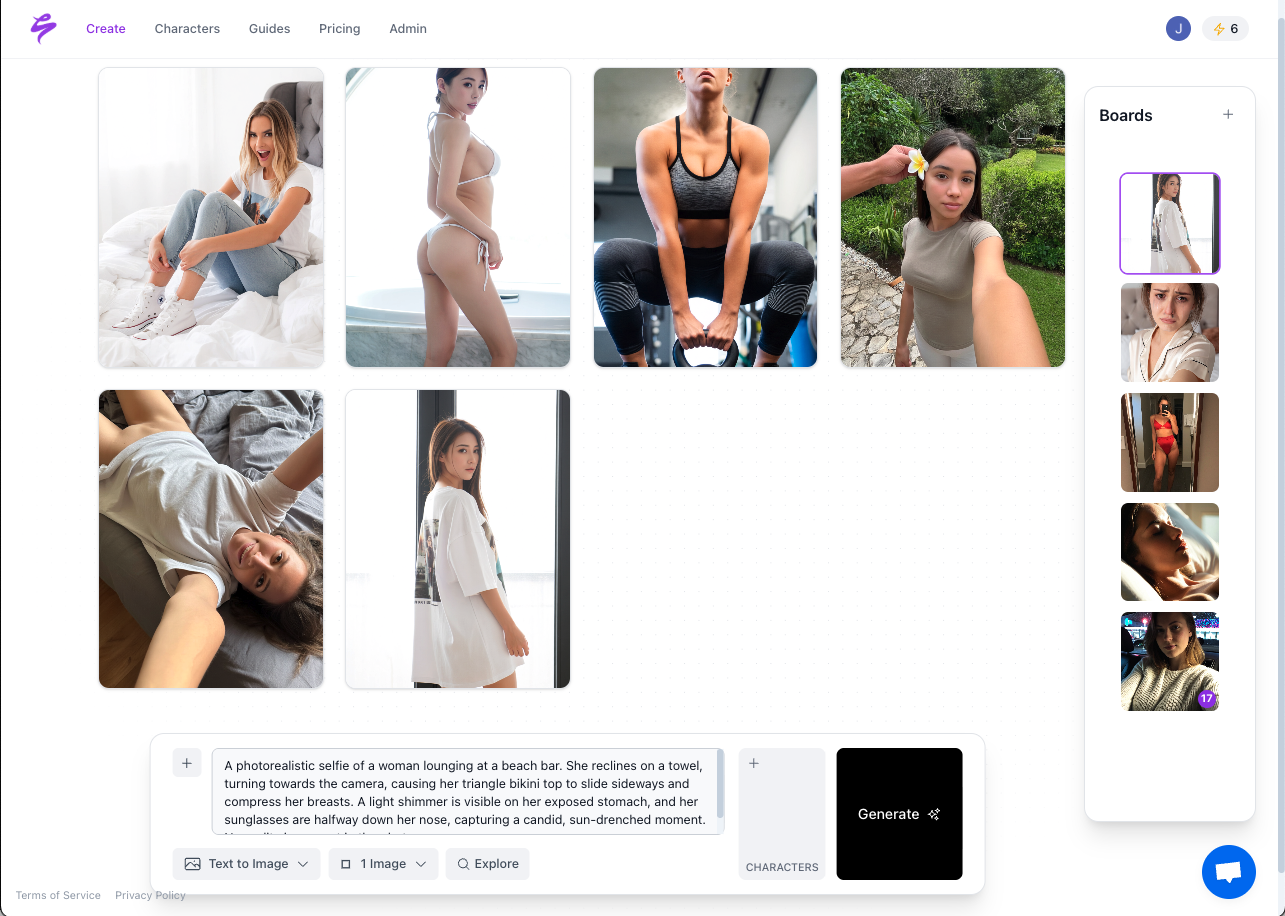
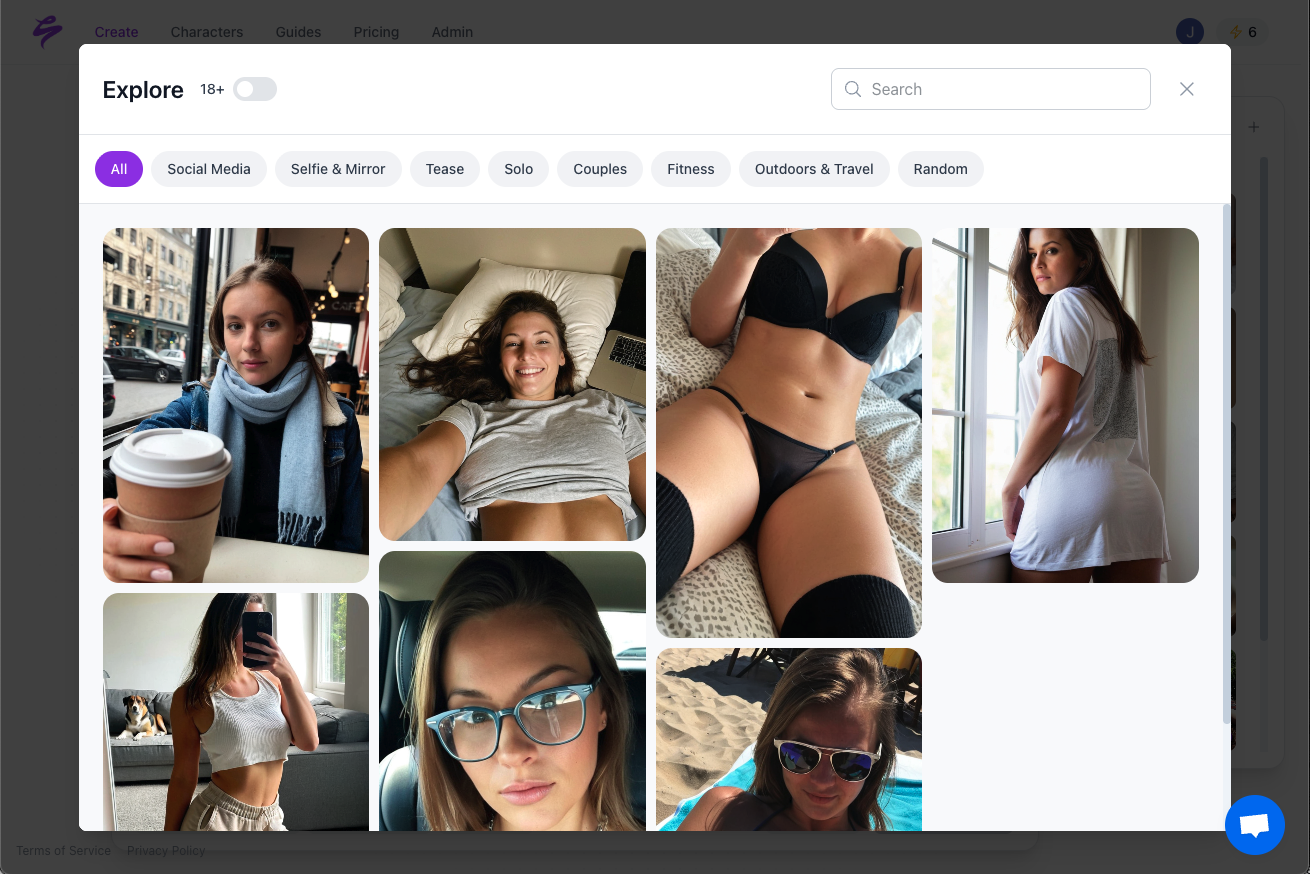
Because those dimensions are reusable, the environments, outfits, and objects you build compound across every shoot instead of being recreated each time. Use Photo Shoot to produce a locked, coherent set of up to ten images from a single frame. Schedule across Instagram, TikTok, X, Facebook, Reddit, and Fanvue with the Scheduler, then read Sozee’s own analytics, including impressions, reach, likes, comments, shares, and engagement split between what Sozee posted and what you posted.
For creators who would rather not learn the tools, the Agent takes a half-formed idea, interviews you into a finished setup, and writes straight into the prompt bar and Photo Control panel. When the conversation ends, the shoot sits one tap from Generate.
Sozee does not replace Stan Store analytics. It acts on what Stan Store analytics reveals by scaling the content you already know converts, without increasing your workload.
Scale The Content Your Stan Store Data Already Proved
FAQ
Is Stan Store Good For Beginners Who Want To Understand Their Analytics?
A beginner opening the Stan Store analytics tab for the first time should focus on three metrics in this order:
- Store visits — confirms that traffic is reaching the store at all. If visits are near zero, no other metric matters yet, because the problem is distribution rather than conversion.
- Conversion rate by product — identifies which product is turning visitors into buyers. A beginner with one product and a low conversion rate has a page or offer problem. A beginner with multiple products can identify which one to promote more heavily.
- Revenue by date range — sets the baseline. Comparing the current 14-day window to the previous 14-day window shows whether the business is growing, flat, or declining, and gives a number to work toward.
Everything else in the dashboard becomes relevant once these three are stable and understood.
How Much Is Stan A Month, And Does The Tier Affect Analytics?
Stan Store offers two paid plans. As covered above, Creator is the entry tier and includes native analytics covering visits, product views, orders, conversion rate, revenue, and customer data. Creator Pro is the only plan that unlocks pixel tracking for Google Analytics, Meta Pixel, TikTok Pixel, and Pinterest, plus affiliate analytics, email flow metrics, and advanced course tracking.
The upgrade decision is an analytics decision as much as a features decision. If you are running paid traffic or an affiliate program and need to connect those channels to your Stan revenue, Creator Pro is the tier that makes that connection possible. For current pricing, check Stan’s pricing page directly, because subscription costs can change.
Why Do My Stan Numbers And My Meta Numbers Never Match?
Stan and Meta measure different things through different methods. Stan counts completed orders recorded in its own system. Meta counts conversions attributed to its ads within its own attribution window, using browser-based pixel data that is affected by ad blockers, iOS privacy settings, and Safari’s cookie restrictions.
The same purchase can appear in Stan but not in Meta if the pixel failed to fire. It can also appear in Meta but not in Stan if the attribution window credits a view-through conversion that Stan has no record of. Both numbers answer different questions. Stan’s number is the most reliable count of actual transactions, and Meta’s number reflects what its algorithm believes it influenced. Use Stan for revenue truth and ad platform numbers for directional optimization signals.
What Pixel Events Does Stan Store Fire?
Stan Store fires three standard pixel events to connected platforms: PageView, Purchase, and Lead. These events are sent to whichever of the four supported platforms you have connected: Google Analytics, Meta Pixel, TikTok Pixel, and Pinterest.
All four pixel and analytics tracking integrations require the Creator Pro plan and are configured by pasting your pixel IDs into the Analytics section of your Stan Store Settings tab. As noted earlier, all four integrations are browser-based pixels subject to ad blockers and privacy settings.
Conclusion: Measurement Is The Easy Part
The Stan Store dashboard gives you the numbers. Traffic sources, conversion rates, income, customer insights, affiliate performance, AutoDM metrics, email flow data, and course retention all sit in one place, filterable by date range and organized by product.
The hard part rarely lives in the measurement. The hard part lives in deciding what to do with the data and then producing enough content that reflects those decisions. The creator economy’s structural problem is that the data almost always points toward more content, while more content is the one thing a human creator cannot produce on demand indefinitely.
Stan Store analytics tells you what happened and which content converted. The production layer that acts on that verdict without burning you out is the missing piece the dashboard cannot provide. Measurement starts the loop, and execution closes it.
Use Sozee To Turn Stan Insights Into Consistent Output