
Key Takeaways
- Instagram Insights shows raw numbers but not what to change. High reach with low engagement means people see your content but do not value it. Low reach with high engagement means the content works, but Instagram is not showing it to enough people.
- Engagement metrics such as saves and shares influence distribution more than likes or comments. Shares are the strongest quality signal because users risk their own reputation when they pass content on.
- Metric combinations reveal what to fix. High profile visits with low follows means your profile fails to convert. High views with low watch time points to a weak hook or poor retention.
- Metric priorities shift with your goal. Growth focuses on reach and follower growth. Engagement focuses on saves and shares. Sales focuses on website taps and follow conversion rate.
- Sozee connects analytics to content creation and scheduling. Start creating now to build content that moves every metric in the right direction.
Core Instagram Insights Metrics By Category
Awareness Metrics
Accounts Reached — The number of unique accounts that saw your content at least once, including in ads. High reach with low engagement means your content is seen but not valued. Low reach with high engagement means the content resonates with viewers, yet Instagram shows it to too few people. The problem sits in distribution.
Views — The total number of times your content was played or displayed, including repeat views by the same account. Instagram retired organic impressions on 21 April 2025 and replaced them with a single unified views metric across all organic formats. Views will always be greater than or equal to reach. High views relative to reach on a Reel means the same accounts rewatch it, which signals strong retention.
Profile Visits — The number of times users tapped through to your profile from a post, Reel, or Story. High profile visits with low follows means your profile fails to convert. The fix is to make the profile answer three questions in three seconds: who you help, what they get, and why they should follow. Tighten your bio to state that offer, pin your three best posts to prove it, and ensure your grid has visual coherence so the proof is obvious at a glance.
Website Taps — The number of times users tapped the external link in your bio. This metric shows clear purchase intent. Low website taps with high profile visits means your bio link lacks a compelling promise or your offer feels unclear.
Engagement Metrics
Likes — The number of times users tapped the heart on your content. Likes are now the weakest major engagement signal. An account with 1,000 likes and 50 DM shares will reach far more people than an account with 5,000 likes and 5 DM shares.
Comments — The number of times users left a comment on your content. Comment depth — threaded conversations or detailed reactions — carries far more algorithmic weight than comment count. Short filler comments such as “great” or “love this” carry minimal weight.
Shares — The number of shares of your posts, Stories, Reels, videos, and live videos. Reels generate the highest share rate at 0.10%, compared to 0.08% for carousels and 0.07% for static images. Shares act as the strongest quality signal because they show a viewer found your content valuable enough to pass to others.
Saves — The number of times users bookmarked your content for later. Saves signal utility because the viewer plans to return. Carousels generate the highest save rate at 0.05%, compared to 0.04% for Reels and 0.02% for static images.
Engagement Rate — The percentage of users who interacted with your content relative to your total reach, impressions, or follower count. The denominator shapes the rate completely. A follower-based rate will always exceed a reach-based rate, and a benchmark quoted without its denominator tells you nothing.
Audience Metrics
Follower Growth — Your net follower change over a chosen period, showing total follows minus unfollows. Flat follower growth with high reach means your content attracts views but fails to turn viewers into followers.
Top Locations — The geographic breakdown of your audience. Use this to time posts and tailor content to your largest region.
Top Age Ranges — The age breakdown of your audience. Use this to adjust tone, references, and examples.
Follow Conversion Rate — Follows divided by profile visits. This metric shows whether your profile does its job. A low follow conversion rate means your content attracts the wrong audience or your profile fails to make a strong case for the follow.
Start creating now to build content that moves every one of these metrics in the right direction.
How To Read Instagram Metrics In Combination
Now that you know what each metric measures, the next step is reading them together. Definitions tell you what a number is. Combinations show what is actually happening. The example below shows how a single Reel’s metrics stack up when the content works. Notice that the strongest signals come from ratios, not raw counts. A Reel has 10,000 views, 4,000 reach, 200 likes, 15 comments, 40 saves, and 25 shares. High views relative to reach means strong rewatch behavior. A 1% save rate signals high utility. A 0.625% share rate signals strong redistribution. Likes and comments matter less here. This Reel deserves replication.
Four metric combinations reveal issues most creators miss:
- High Reach + Low Saves. Your content is seen but not valued. Increase utility or emotional payoff. Add a framework, checklist, or step-by-step breakdown so the post earns a save. Saves act as a clear signal that a viewer plans to return and often earn broader distribution over time.
- Low Reach + High Engagement. The content itself works, yet Instagram shows it to too few people. Revisit your hooks, posting time, and format. Among non-followers, a Reel first reaches a small test audience. Strong early response earns progressively wider distribution. Check whether your openings hold attention for the first 1.5 to 3 seconds.
- High Profile Visits + Low Follows. Your profile fails to convert. Tighten your bio to state who you help and what they get. Pin your three best-performing posts and keep your grid visually coherent.
- High Views + Low Watch Time On Reels. The hook works but retention fails. Shorten the setup and move the payoff earlier. Cut any moment that does not serve the first three seconds. A Reel watched to completion by 1,000 people receives greater distribution than a Reel watched briefly by 10,000 people.
Which Instagram Metrics To Track For Each Goal
The AI Overview on this topic states it cannot prioritize metrics without a clear goal. The framework below fills that gap. Find your main goal, track only the listed metrics, and ignore the rest for that campaign.
- Growth / Awareness. Watch Accounts Reached, Views, and Follower Growth. Ignore Likes and Comments. The goal is distribution. Reels get roughly 36% more reach than carousels, which makes them stronger for reaching non-followers.
- Engagement / Community. Watch Saves, Shares, and Comments. Ignore Reach and Views. The goal is depth of relationship. Carousels earn a 6.90% engagement rate by reach versus 3.31% for Reels, so carousels suit depth-focused content.
- Sales / Conversions. Watch Website Taps, Profile Visits, and Follow Conversion Rate. Ignore Likes and Comments. The goal is action.
- Reels Performance. Watch Watch Time, Shares, and Follows from Reels. Ignore Likes and Reach. For Reels growth, prioritize watch-completion rate, then shares, then saves, comments, and likes. DM shares act as the hardest signal to game and the clearest sign of real value.
Direct Answers To Common Instagram Rules
Beyond metric priorities, several named rules circulate in Instagram advice. Here is what each one means and how to use it.
What Is The 5-3-1 Rule On Instagram?
The 5-3-1 rule describes a daily engagement habit: like five posts, leave three genuine comments, and follow one account within your target audience. Some versions swap the follow for sending one DM. This rule comes from practitioners, not Instagram. A content-mix version also exists: out of nine posts, five educate or inspire, three build connection, and one sells.
What Is The 3-2-1 Rule On Instagram?
The 3-2-1 rule describes a weekly content mix: out of six posts, three educate, two engage, and one promotes. Some creators use a different version as an engagement routine: interact with three accounts, reply to two comments, and send one DM. Neither version is an Instagram-native feature.
What Is The 80/20 Rule On Instagram?
The 80/20 rule means 80% of your posts give value and 20% promote. It works as a proportion that fits any posting frequency. You only learn which 20% mattered after posting, so the practical move is to publish consistently, spot winners, and double down.
Engagement Rate Benchmarks And Key Reels Metrics
What Is A Good Engagement Rate On Instagram? There is no single number that fits every account. Engagement rate declines systematically with account size: 1K–10K follower accounts average 3.5–6%, 10K–100K average 1.5–3.5%, 100K–1M average 0.8–2%, and 1M+ accounts average 0.3–1%. Three large studies produced medians of 0.30%, 0.48%, and 5.46% for the same platform because they used different denominators and interaction types. Benchmark against your own trailing average across your last 12 posts and compare only within your follower tier.
Reels-specific metrics worth watching:
- Reels Watch Time Vs. Views. Views show how many times your Reel was played. Average watch time shows the average time spent playing the Reel. High views with low watch time point to a hook problem. Lower views with high watch time point to a distribution issue that improves as retention holds.
- Average Watch Time. Compare this against your Reel’s total length. Reels that consistently fall under 60% completion usually have a weak hook or lose the point in the middle. If average watch time stays under half your Reel’s length, retention fails.
- Shares. The number of times your Reel was shared via DM or to a Story. DM shares are worth three to five times more than likes for reaching new audiences.
- Follows From Reels. The number of new followers attributed to a specific Reel. High views with low follows means the Reel entertains but does not make a strong case to follow.
Use Sozee’s analytics to see which Reels drive watch time, shares, and follows.
Troubleshooting When Instagram Metrics Drop
Why Did My Instagram Reach Drop?
Diagnostic: Compare reach by week for the last two months instead of judging a few days. Write down the exact date reach dropped and match it to changes such as a new bio link, posting time, content pillar, or a sudden influx of followers. Check Account Status in the Instagram app to see whether your account or posts were flagged. Common causes in 2026 include low watch time completion on recent Reels, reposted or watermarked content, inconsistent niche posting, high “Not Interested” signals, and chasing likes alone.
Fix: If no flag appears, sort your last 20 posts by reach in Insights. Compare the highest performers against the lowest. Look for patterns in format, hook style, and posting time. Use those patterns to design your next batch of posts.
Why Did My Engagement Drop?
Diagnostic: The identity Follower-based ER = Reach-based ER × Reach rate lets you split a falling follower-based engagement rate into content appeal versus audience delivery. Calculate both follower-based and reach-based engagement. If reach-based engagement holds while follower-based engagement drops, delivery shrank. If both fall, content appeal declined.
Fix: Create one genuinely save-worthy post such as a step-by-step breakdown, reference sheet, or framework. Pin it to your profile so every new visitor sees proof of value.
Why Is My Follower Growth Stagnant?
Diagnostic: Check your follow conversion rate, which equals follows divided by profile visits. High profile visits with low follows means your profile fails to convert.
Fix: Tighten your bio to state who you help and what they get. Pin your three best-performing posts and keep your grid visually coherent. Structure your bio as “Who you help + What you help them do + Result” so visitors grasp your offer within seconds.
Where Sozee Fits In Your Instagram Workflow
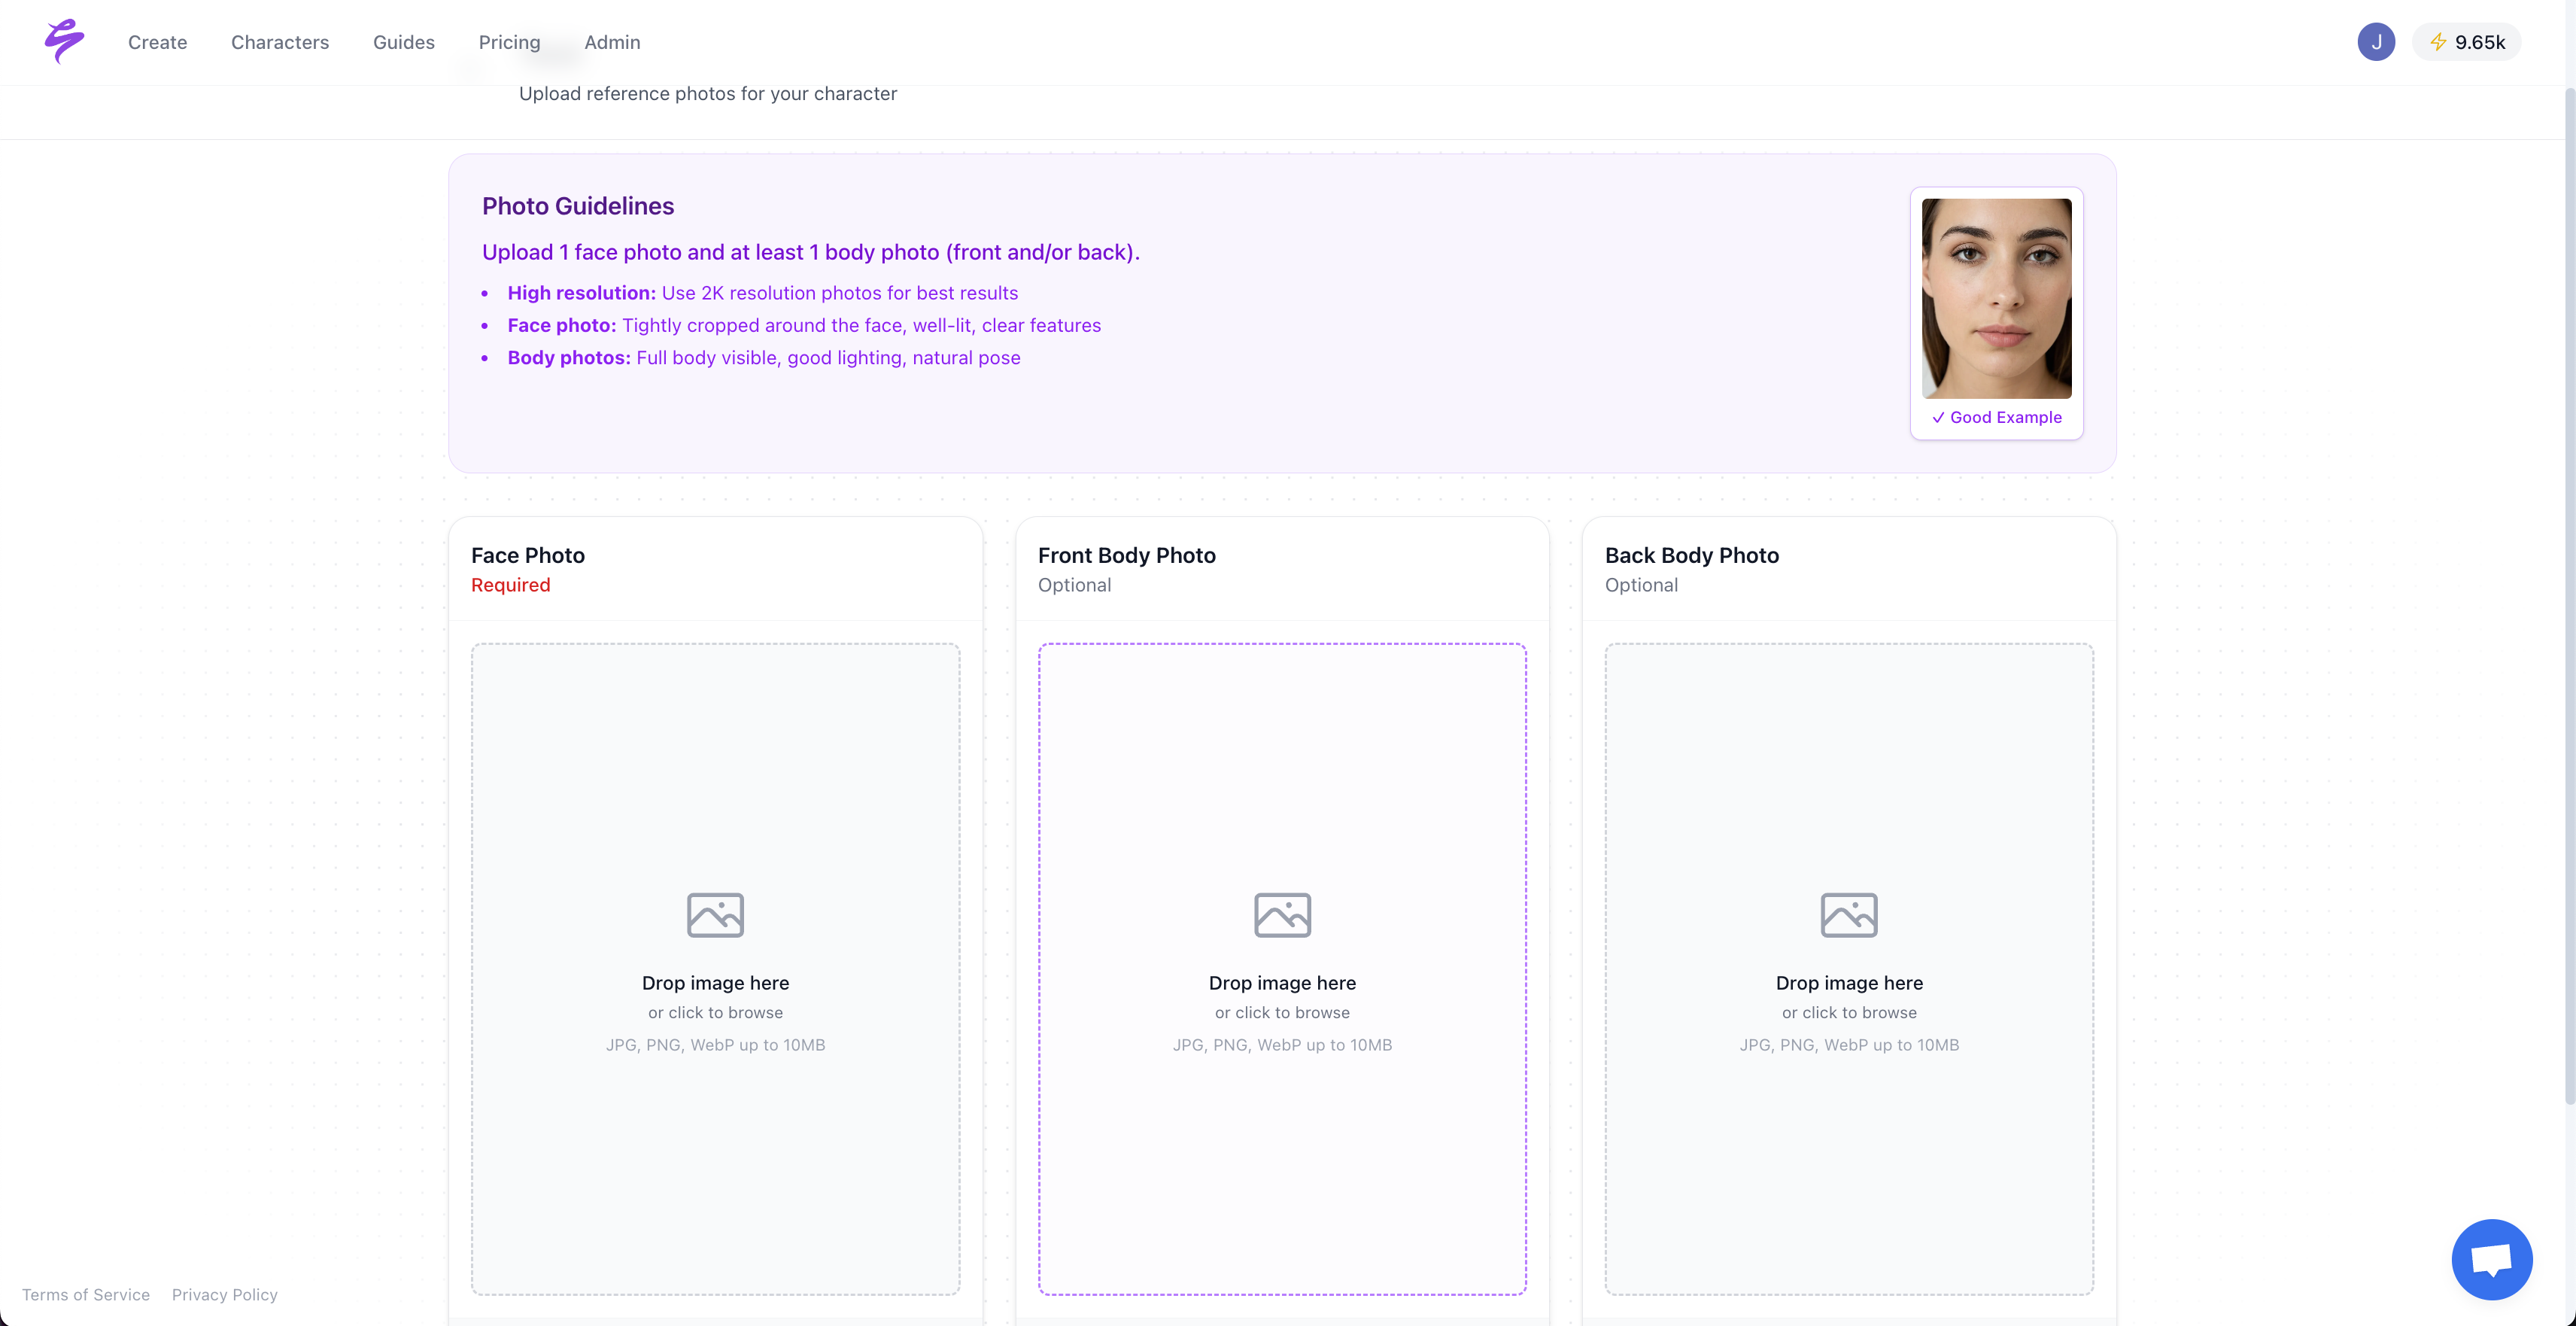
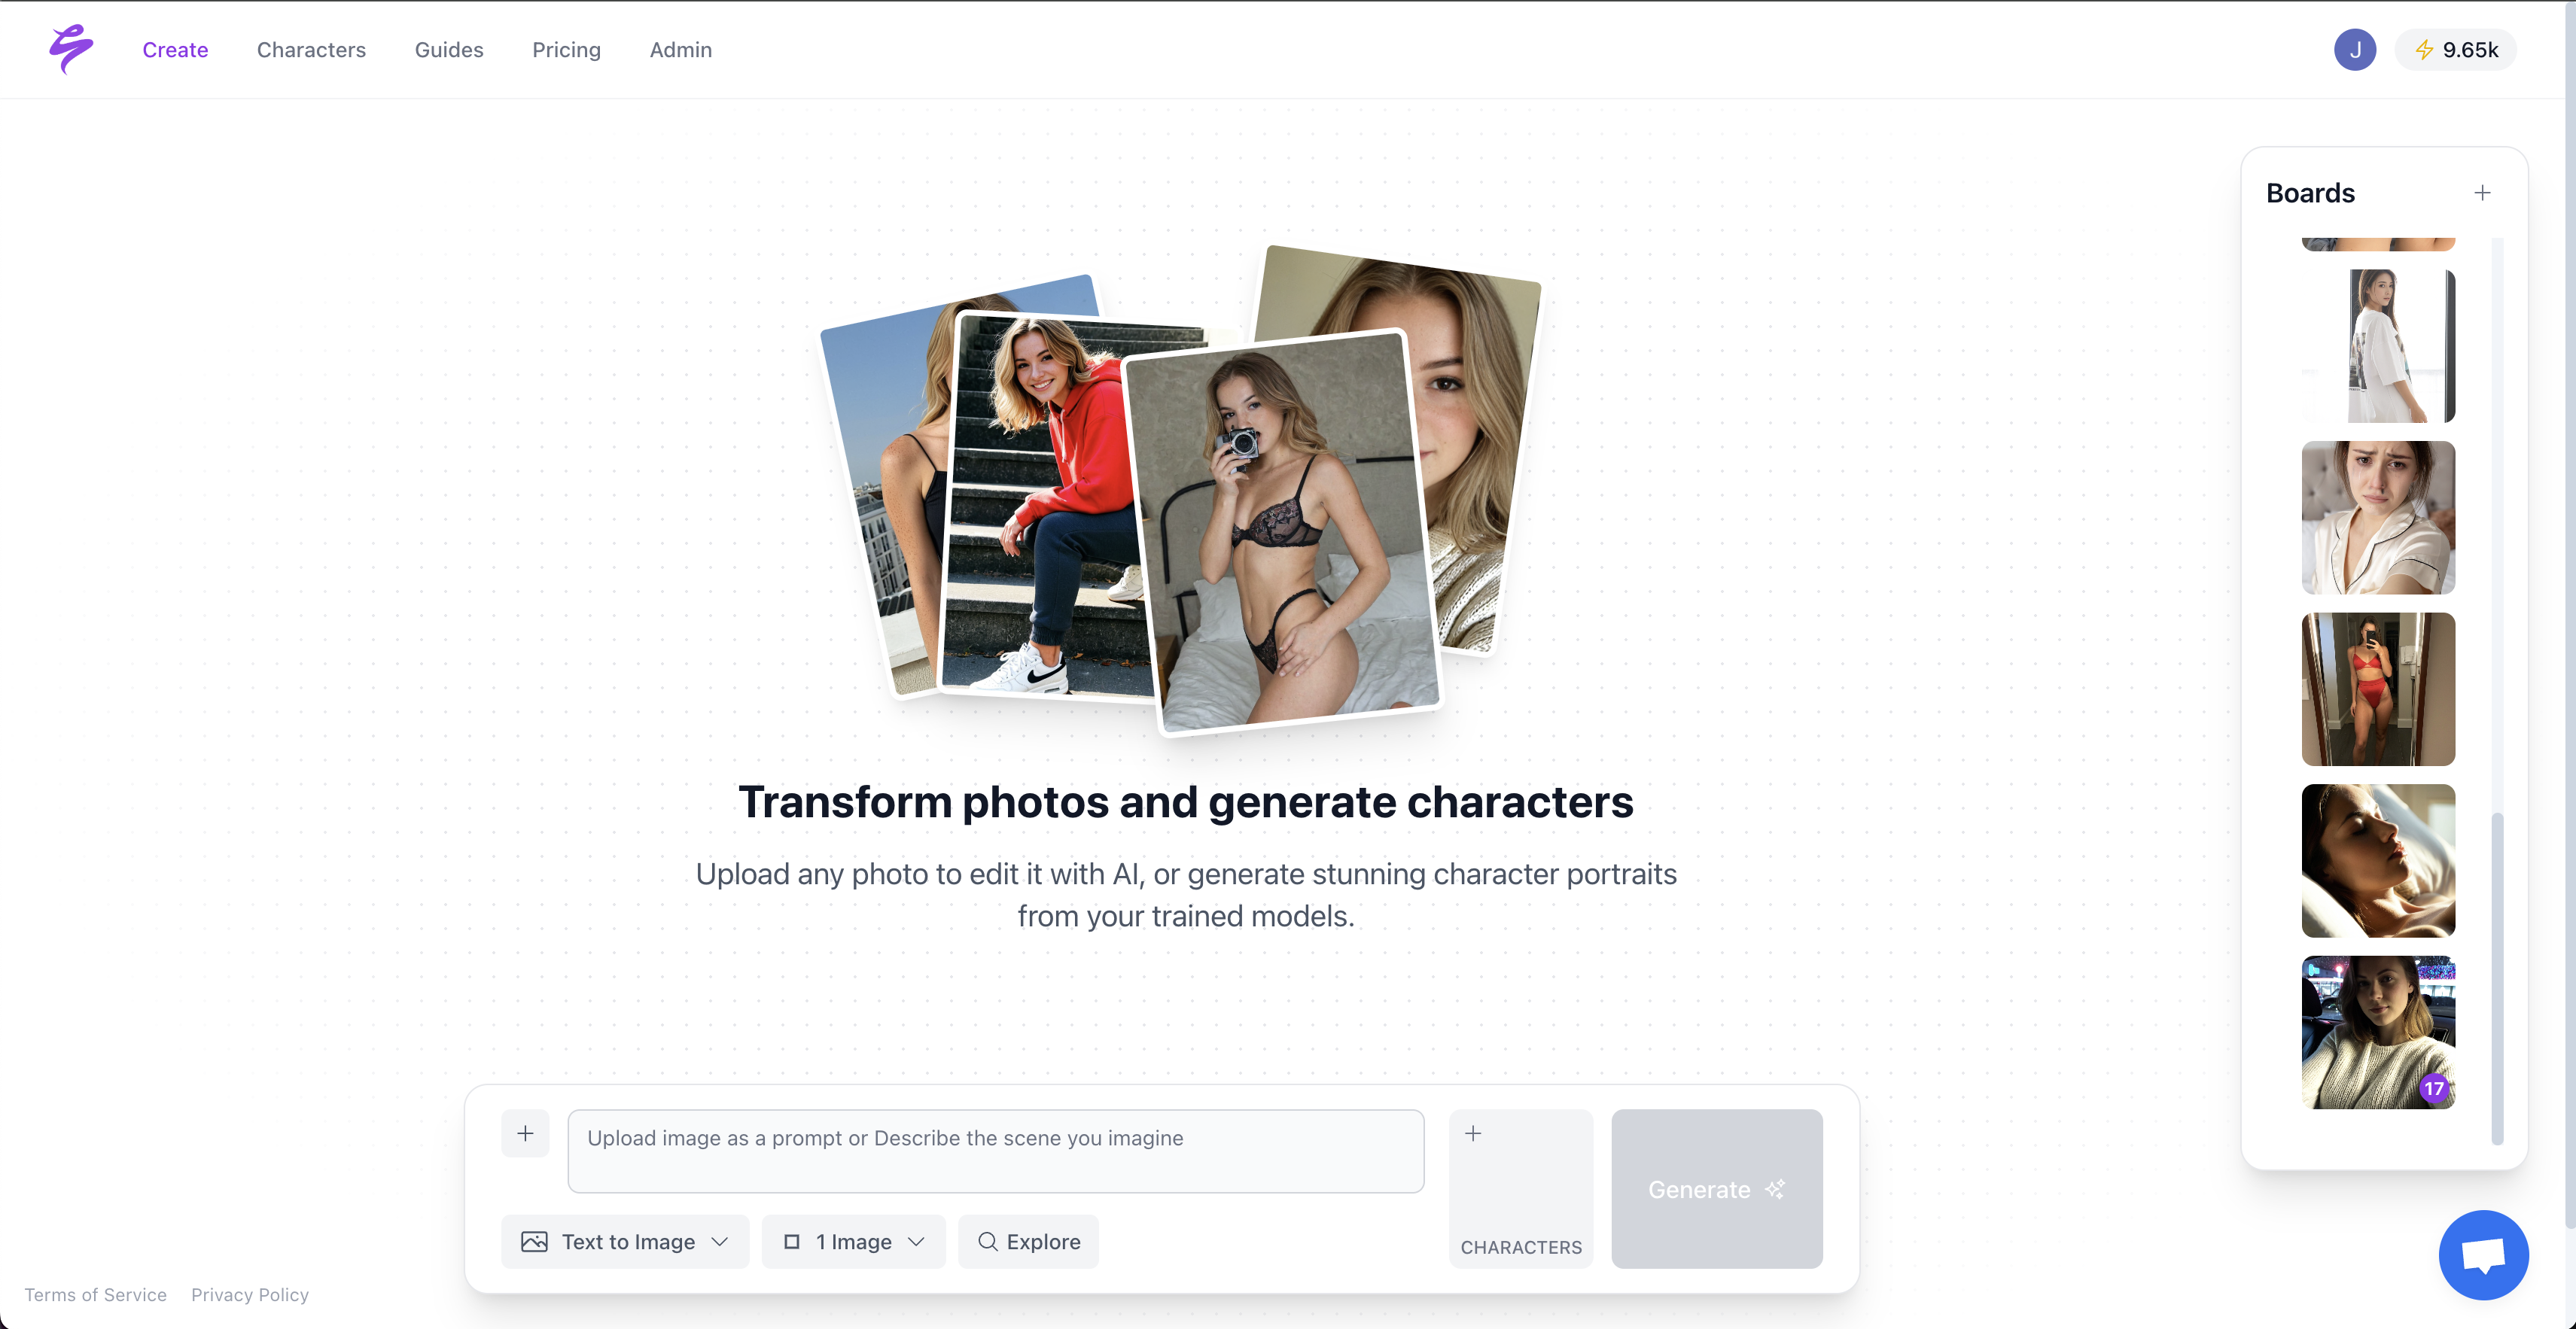
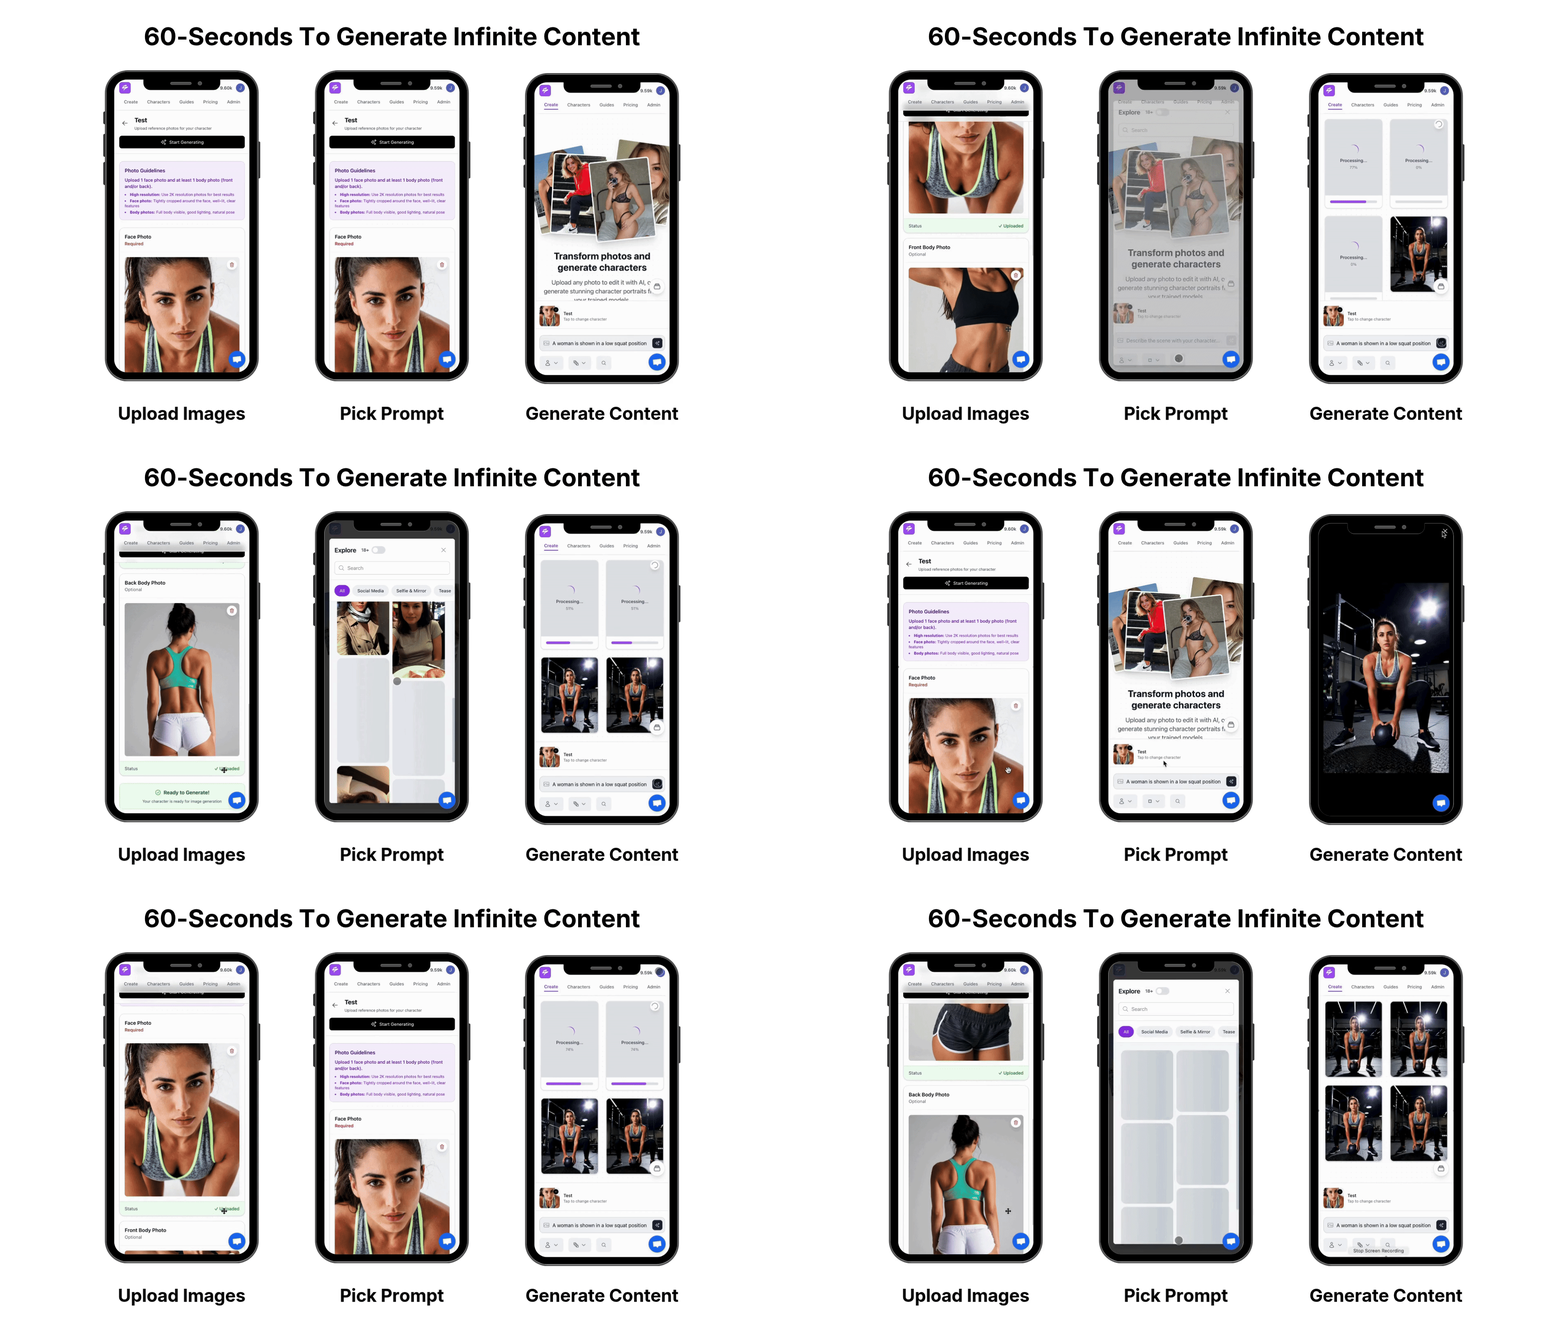
Creators can see their Instagram Insights metrics but often struggle to act on them quickly enough to change outcomes. Sozee closes that loop natively. The Scheduler connects Instagram, TikTok, X, Facebook, Reddit, and Fanvue per character. Publishing happens in the same place you build content. Sozee’s Analytics reports impressions, reach, likes, comments, shares, and engagement. It also splits what Sozee posted from what you posted, so you can see exactly what the platform contributed. Because Sozee also produces the content through locked likeness, reusable settings, outfits, objects, Photo Shoot sets, and Reel cloning, every diagnostic fix in this article can happen where you read the metrics. Low saves become a new carousel framework built in minutes. Weak Reel retention becomes a cloned, proven format with your locked likeness. High profile visits with low follows become a pinned-post set that converts.
Get started with Sozee to cast your character, direct your shoot, and publish content built to move the metrics that matter.
FAQ
What Does “Views” Mean In Instagram Insights?
See the Views entry under Awareness Metrics for the full definition. The key point is that views count repeat plays, so the number will always be greater than or equal to reach. A large gap between the two signals replay activity and strong retention.
What Does “Navigation” Mean In Instagram Insights?
Navigation shows how users moved through or away from your content, such as taps forward to the next Story, taps back to replay, exits, or taps to your profile. For Stories, it highlights the exact frames where viewers leave or re-engage. A high exit rate on a specific frame points to a drop in interest at that moment.
What Is A Good Engagement Rate On Instagram?
See the Engagement Rate Benchmarks section above for the full breakdown by follower tier and denominator. Use those ranges as context and track your own trailing average across your last 12 posts.
Why Did My Instagram Reach Drop?
See the Troubleshooting section above for the full diagnostic sequence. Start with Account Status, then compare your last 20 posts by reach and look for shifts in content, hooks, and posting cadence.
Conclusion: Turn Metrics Into Your Next Post
Instagram Insights only matter when they change what you post next. A reach number without a decision stays as a number. A save rate without a content adjustment stays as a data point. The loop closes when a metric triggers an action such as a different hook, a new format, a tighter bio, or a save-worthy carousel. Sozee gives you one place to read the metrics, produce the fix, publish the result, and measure again.