
Key Takeaways
- Instagram content performance tracking works best as a simple weekly system that turns data into clear posting decisions.
- A five-step loop of goal, metrics, recording, comparison, and one change separates growing accounts from those that guess.
- Personal 30-day median baselines give more reliable guidance than industry benchmarks because they reflect your audience and content mix.
- Recording metrics after the initial performance spike settles keeps comparisons consistent across posts.
- Sozee connects performance data directly to the next shoot so creators can turn weekly insights into scheduled content in one place.
How to Track Metrics on Instagram
Instagram Insights is a free analytics tool available only to Business and Creator (Professional) accounts. The walkthrough below shows the native path, timeframe options, and where each core metric lives.
- Open your profile. Tap your profile picture in the bottom-right corner of the Instagram app.
- Tap Professional Dashboard. This button appears near the top of your profile, below your bio. If it does not appear, tap the three-line menu in the top-right corner and select Insights under the “For professionals” section. Meta’s Instagram help documentation notes that if the dashboard does not appear on the profile, users can tap More to go to Settings and activity.
- Tap See All Insights. This opens the account-level overview, which organizes data into four top-level categories: Views, Interactions, New Followers, and Content You Shared.
- Choose a timeframe. Instagram Insights offers preset timeframes of 7, 14, 30, or 90 days. To set a custom range, tap the dropdown menu on any insight, select a custom start and end date, and tap Update. Custom date ranges stay within the 90-day window.
- Note the 90-day limit. Looking back beyond 90 days is only available to eligible public accounts with a Meta One subscription on Advanced, Expert, or Max plans. Without Meta One, account-level data older than 90 days is inaccessible in Instagram Insights unless you recorded it externally.
- Select a content type. Under “Content You Shared,” filter by posts, Reels, or Stories to compare formats within the same period.
- Open an individual post or Reel for per-content metrics. For a feed post, tap “View Insights” below the post. For a Reel, open it, tap the three dots, and select Insights. Individual Reel Insights include views, viewers, average watch time, skip rate, share rate, like rate, save rate, repost rate, and comment rate. Record these numbers externally. The 90-day window means any data not saved is eventually lost.
What Are the Most Important Instagram Metrics?
The most important Instagram metrics depend on the goal behind a piece of content. Organizing metrics by objective makes tracking easier to act on. Three terms need clear definitions before you map goals to metrics.
Views count the total number of times content was played or displayed, including replays by the same account. As of April 21, 2025, Instagram deprecated organic impressions and plays across its interface and API, replacing them with a unified Views metric that applies to Reels, feed posts, carousels, photos, Stories, and Live.
Reach counts the number of unique accounts that saw content at least once. Sprout Social defines reach as the total number of unique users who see your content, with each user counted only once regardless of how many times they view it. One person watching a Reel three times generates three Views but a Reach of one.
Impressions was the prior metric for total displays, counting every repeat view. Meta retired the Impressions metric for organic Instagram content and replaced it with Views, fully in effect since April 21, 2025. Impressions remains active only in Meta’s paid Ads Manager. Any tool still showing “impressions” for organic content posted after April 2025 is either using historical data or has silently remapped the field to Views.
The table below maps each common goal to the metrics that measure progress toward it, so you can focus on numbers that move your account forward.
| Goal | Metric | Why It Matters |
|---|---|---|
| Reach & Discovery | Reach (Accounts Reached); Non-Follower Reach % | Instagram splits reach into followers and non-followers per post, and non-follower reach is the acquisition signal. Found under Views in the account dashboard or per-post Insights. |
| Engagement | Saves; Shares; Engagement Rate by Reach | Saves and shares are highly valuable engagement metrics that carry heavy weight in Instagram’s ranking algorithm and are stronger growth indicators than likes. Engagement Rate by Reach = (Likes + Comments + Saves + Shares) ÷ Reach × 100. Found under Interactions in Insights. |
| Video Performance | Average Watch Time; Skip Rate; Views-to-Reach Ratio | Instagram’s ranking signals for Reels include watch time, retention, shares, likes, and comments. Skip rate (percentage who left in the first 3 seconds) and average watch time are found in individual Reel Insights. |
| Audience Growth | Follower Growth; Follows per Post; Non-Follower Reach | The New Followers section of Instagram Insights provides total followers, follower growth, follower growth rate, top locations, age range, gender, and most active times. Per-post follows appear in individual post Insights. |
| Traffic & Conversion | Profile Visits; Link Taps (Story link sticker); Follows from Post | Instagram’s profile visits metric counts the number of times a profile was visited from a piece of content. Link taps from Story link stickers are found in individual Story Insights. |
How Many Views Are Good on Instagram?
No single view count defines good performance on Instagram. Account size, niche, content format, and follower count all change what “good” means for a specific account. A published benchmark table should function as a check that you are in the right order of magnitude for the account size and industry.
Benchmark reports vary by 4–26× for the same metric due to methodological inconsistencies, including different denominators, interaction sets, and sample constructions. Chasing a number from a report built on a different account size, niche, and formula produces no useful signal.
A personal 30-day baseline gives a practical alternative. Here is how to build one:
- Open Instagram Insights and set the timeframe to the last 30 days.
- For each post or Reel published in that window, record the metric tied to your current goal: Views, Reach, or Engagement Rate by Reach.
- Calculate the median value across those posts. The median is more reliable than the mean because one viral outlier will not distort it.
- Record this median as your baseline for the current goal metric.
- For every new post, compare its performance against that median after the initial performance period. Reels and carousels can gain significant reach 3–7 days after posting, so avoid judging within the first 24 hours.
A post performs above baseline when it beats your 30-day median on the metric tied to your current goal. That comparison is the benchmark that controls for your audience, your niche, and your posting mix at the same time. New accounts under 90 days old underperform industry engagement averages by 30–50% as algorithms calibrate and audiences build, and should benchmark against their own trailing 30-day baseline instead of industry figures.
How to See Analytics on Instagram Without a Professional Account
Personal accounts do not have access to Instagram Insights. Instagram Insights is a free analytics tool available only to Business and Creator (Professional) accounts; personal accounts have no access, and switching to a Professional account is free and takes under a minute.
To switch to a Professional account:
- Go to your profile and tap the menu icon in the top-right corner.
- Select Settings and Privacy.
- Tap Account Type and Tools.
- Select Switch to Professional Account.
- Choose Creator or Business and select a category.
- Optionally connect a Facebook Page.
Switching to a professional account makes the account public by default; private accounts are automatically switched to public, and Instagram does not allow private professional accounts. The switch is reversible, but switching back to a personal account deletes all accumulated Insights data. Switching to Professional again starts analytics fresh because historical data does not backfill.
Third-party tools that rely on Instagram’s public API can surface some data, such as follower counts, post counts, and estimated engagement rates, for public accounts without a Professional account connection. However, they cannot access private metrics such as reach, saves, Story tap-through rates, or audience demographics. Free tools like Social Blade and NotJustAnalytics pull from Instagram’s public API and provide reasonably accurate follower growth and engagement rate data for public accounts, but they cannot access private metrics like reach, impressions, or Story tap-through rates that require API authorization.
Instagram Content Performance Tracking Template
A weekly tracking table can stay simple and still be powerful. The goal is to record enough data to spot a pattern across four to six weeks, then make one deliberate change. The table below is tool-agnostic and works in any spreadsheet application.
| Date | Content Type | Goal | Metric 1 | Metric 2 | Metric 3 | Baseline Comparison | One Change For Next Week |
|---|---|---|---|---|---|---|---|
| YYYY-MM-DD | Reel / Post / Story / Carousel | e.g., Discovery | e.g., Reach: 4,200 | e.g., Non-Follower Reach: 61% | e.g., Shares: 38 | Above / Below / At Baseline | e.g., Test a Tighter Hook in First 2 Seconds |
To fill this in under 20 minutes a week:
- Wait until performance has stabilized after each post so early fluctuations settle.
- Once the data has stabilized, open Insights for each post published in the past seven days and copy the three metrics mapped to your current goal into the table.
- With your numbers recorded, compare each result to your 30-day median baseline and mark it above, below, or at baseline.
- Finally, use that comparison to write one specific change to test next week. Focus on a single variable instead of a complete strategy overhaul.
The “One Change For Next Week” column is the habit that makes tracking useful. MeetEdgar’s Instagram analytics guide advises treating each weekly analytics review as a small test rather than a verdict, changing one variable at a time and giving it a few attempts before drawing conclusions. Without that column, tracking stays observational. With it, tracking becomes a decision loop.
Turn Your Weekly Insights Into Content
Instagram Insights vs. Third-Party Analytics Tools
Native Instagram Insights covers most of what a single-account creator needs for weekly tracking. Certain scenarios still call for third-party tools.
- Historical data beyond 90 days. Third-party tools like Socialinsider allow analysis of up to two years of historical Instagram data, which supports seasonal comparisons and long-term trend identification that the native 90-day window cannot provide.
- Competitor context. Instagram Insights only covers your own account. Tools like Iconosquare and Rival IQ allow benchmarking against competitor public profiles.
- Cross-platform comparison. Native Insights does not aggregate data across Instagram, TikTok, and other platforms in one view.
- Attribution by posting source. When a creator uses a scheduling or content platform, native Insights does not distinguish between what the platform posted and what the creator posted manually. Sozee’s analytics split these two streams, showing exactly what Sozee contributed in impressions, reach, likes, comments, shares, and engagement, so creators can evaluate the platform’s direct impact on performance.
Instagram analytics workflows typically fall into three tiers: direct in-app checks (free, limited historical data, low scalability), manual exports and spreadsheets (free in software terms but time-expensive, medium scalability), and third-party reporting tools (paid, stronger long-term data storage, high scalability). The right tier depends on account complexity, team size, and how far back the data needs to go. Even the strongest third-party tool still focuses on reporting what happened rather than helping you act on it.
Why Sozee Is the Best Solution for Instagram Content Performance Tracking
Sozee treats analytics as the starting point for your next content cycle instead of the final report. That shift turns weekly tracking into a direct input for production.
Sozee is the AI Content Studio for the Creator Economy. It connects Instagram, TikTok, X, Facebook, Reddit, and Fanvue per character and schedules photos, carousels, Reels, and Stories with a caption per platform and a live preview of the real post. Sozee’s analytics track impressions, reach, likes, comments, shares, and engagement, with a split between what Sozee posted and what the creator posted. That split gives proof of exactly what the platform contributed.
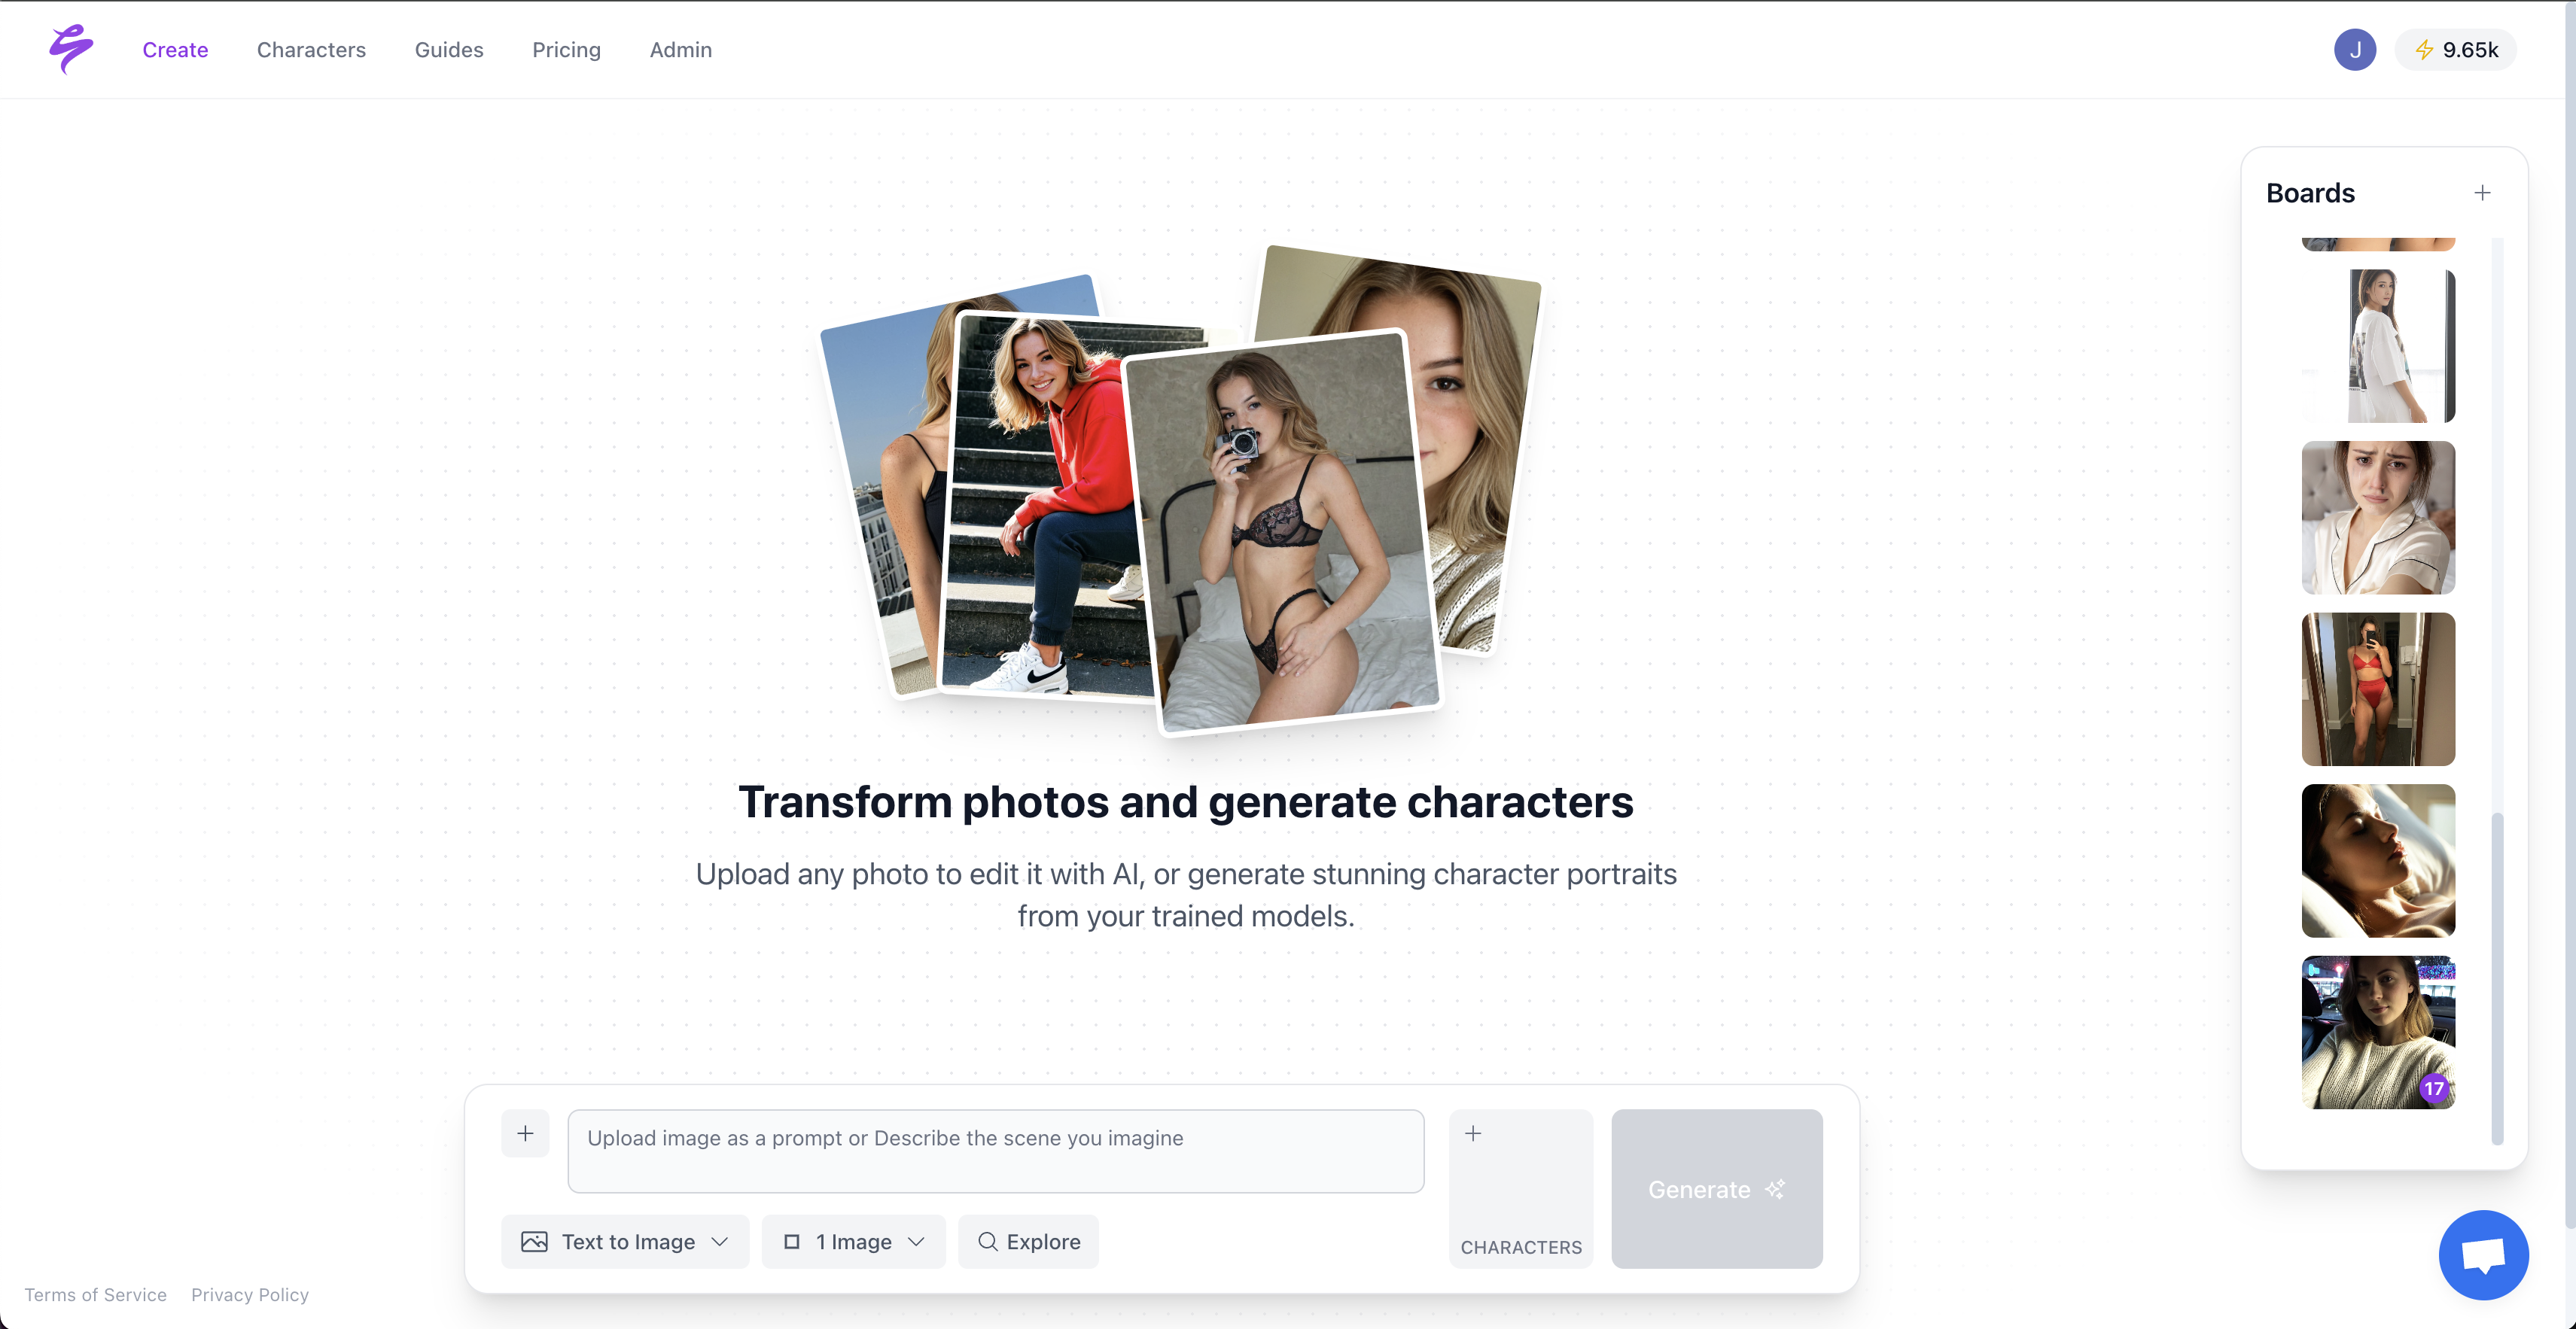
The connection between tracking and production is where Sozee is structurally different. When the weekly decision loop produces a finding, such as a hook style that outperformed baseline or a setting that drove non-follower reach, that finding feeds directly into the next shoot inside Sozee without a new production day. Sozee’s locked likeness and reusable libraries for Settings, Outfits, and Objects mean the creative decision from tracking becomes a shoot setup in minutes. Build a location once. Shoot in it for a year. Change one variable, such as the outfit, the expression, or the object, and the next post is ready.
Sozee’s Photo Shoot feature takes a single image and builds a coherent set of up to ten around it. Identity, outfit, and environment stay locked, and only angle, pose, and expression vary. A month of content can come from one frame. For creators who want the next shoot set up without touching the controls, Sozee’s Agent interviews them into a finished setup, resolving character, setting, wardrobe, shot, expression, and output, and writes straight into the prompt bar and Photo Control panel. When the conversation ends, the shoot sits one tap from Generate.
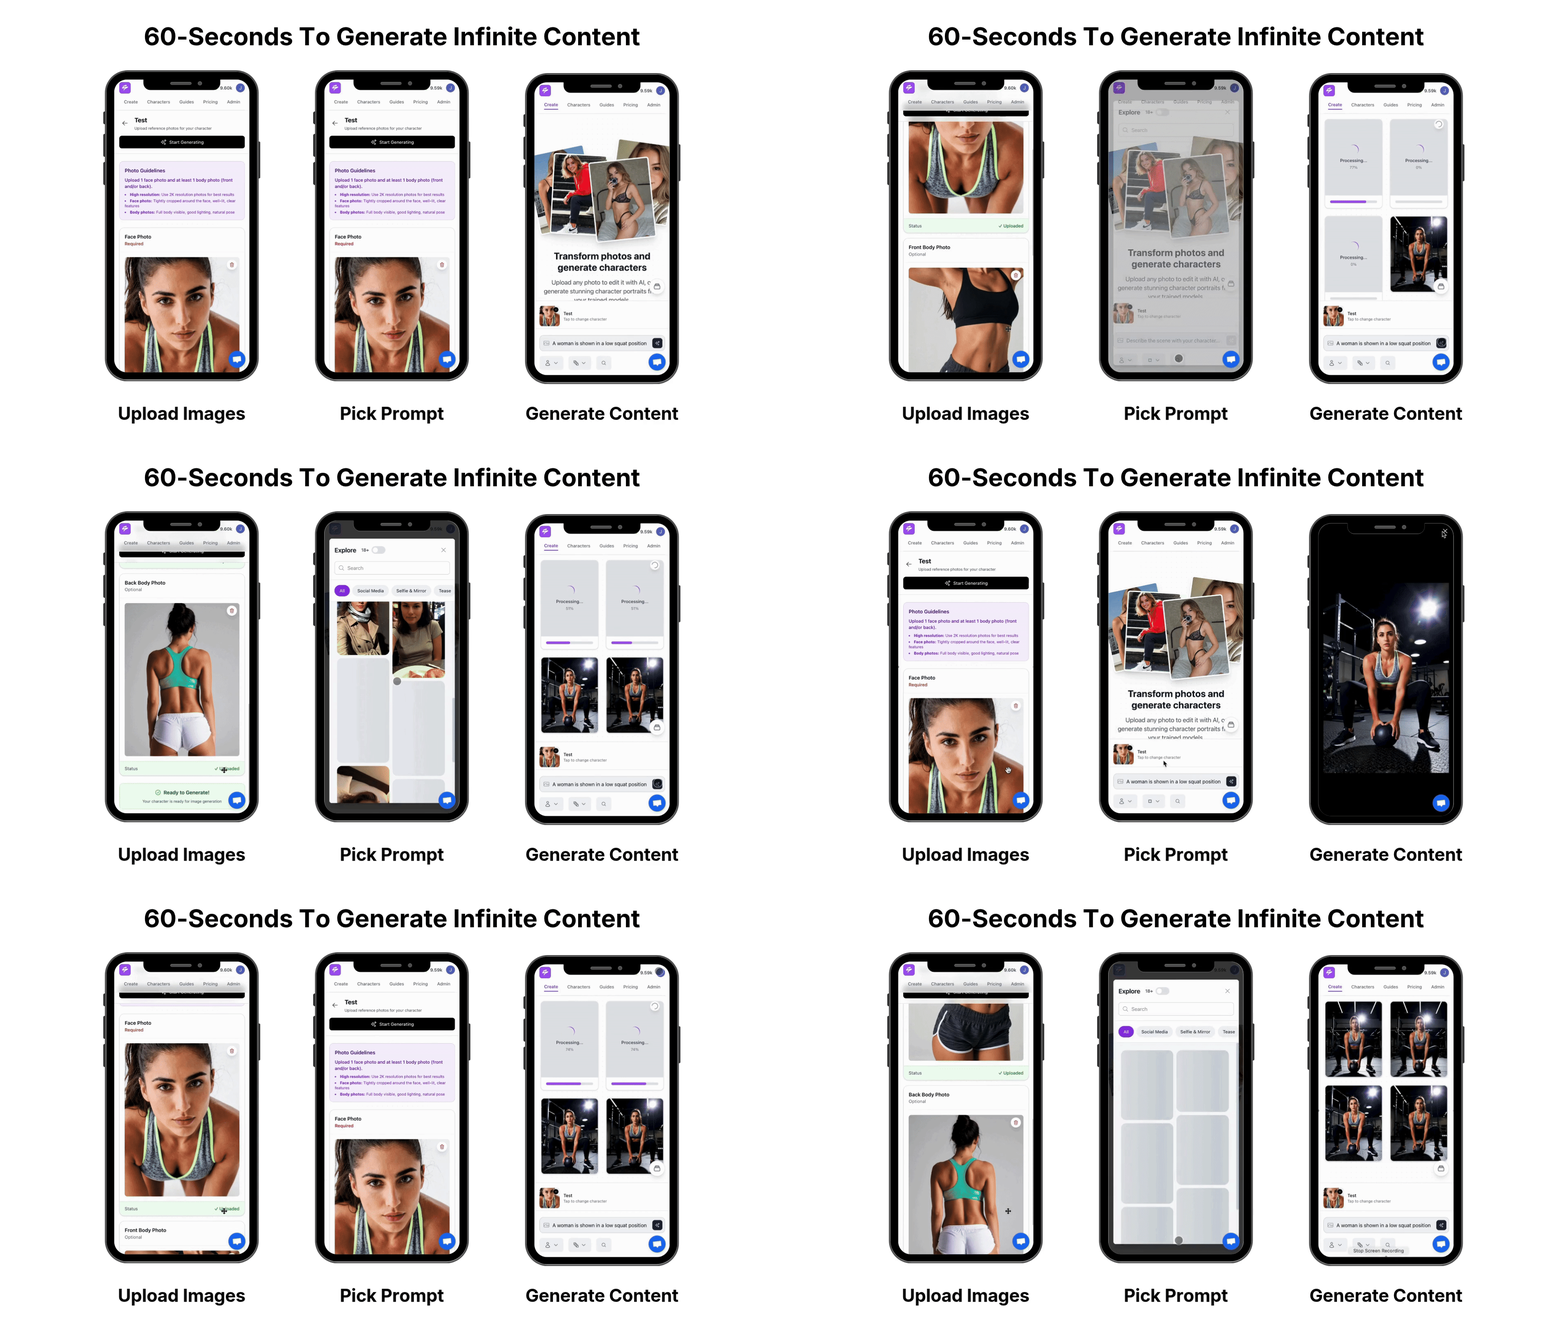
The weekly tracking loop described in this guide produces a creative decision every week. Sozee is the platform that turns that decision into a scheduled post without leaving the same tool.
Start Creating With Sozee Today
FAQ
What Are Some Important KPIs to Track for Instagram?
The most important Instagram KPIs depend on the goal behind the content. For discovery, track Reach and Non-Follower Reach percentage. For engagement depth, track Saves, Shares, and Engagement Rate by Reach. For video, track Average Watch Time and Skip Rate. For growth, track Follows per Post and Follower Growth Rate. For traffic, track Profile Visits and Story Link Taps. Mapping two or three metrics to a single goal per week produces more actionable data than tracking every metric at once.
Is 1,000 Views a Lot on Instagram?
One thousand views can be strong for a small account and weak for a large one. A nano account with 800 followers reaching 1,000 views on a Reel is performing well above its follower count. The same number on an account with 50,000 followers may sit below its usual baseline. The most reliable benchmark is the median Views across your own last 30 posts for the same content format.
How Often Should I Review Instagram Content Performance?
A weekly review cadence works for most accounts. Daily checks introduce noise from normal short-term fluctuations, and monthly checks are often too slow to catch a pattern early enough to act on it. A 15–20 minute weekly session, checking posts after they have been live long enough to stabilize and comparing performance to your own baseline, is a recommended approach to build a repeatable improvement loop. A deeper monthly review of account-level reach, engagement rate, and follower growth adds strategic context without requiring daily attention.
Can I Track Instagram Performance Without a Professional Account?
Tracking without a Professional account stays partial and approximate. Personal accounts have no access to Instagram Insights, which means no reach data, no saves, no audience demographics, and no per-post engagement breakdown. Third-party tools that use Instagram’s public API can estimate follower growth and engagement rates for public accounts, but they cannot access private metrics. Switching to a Professional account is free, takes under two minutes, and is reversible, although switching back to personal deletes all accumulated Insights data. For any serious tracking system, a Professional account is a prerequisite.
Conclusion
Instagram content performance tracking works as a habit, not as a one-off dashboard check. The weekly loop described above, built on a clear goal, mapped metrics, consistent recording, comparison to a 30-day baseline, and one change, turns analytics into a creative engine.
The baseline gives you a benchmark built for your account size, niche, and content mix. The one-change rule turns reactive strategy overhauls into controlled, readable tests. The weekly cadence replaces sporadic dashboard checks with a system that compounds.
Creators who pair that tracking system with a production platform like Sozee close the loop entirely. The insight from tracking becomes the brief for the next shoot. The next shoot becomes a scheduled post. The scheduled post generates new data. The loop runs again, with less friction and a direct line between what the data said and what went live.