
Key Takeaways
- Content creator analytics matters when a metric change tells you exactly what to publish next.
- Growth comes from retention and completion rate. Sponsorship value depends on consistent reach and stable engagement. Revenue is best measured by revenue-per-view and conversion.
- Native dashboards are the only source of truth for retention, watch time, and revenue.
- Diagnose in chronological order. When a metric moves, identify the first change, then apply the matching next action from the diagnostic framework.
- Sozee is the only platform that closes the loop from analytics to production. Turn your metrics into your next shoot with Sozee.
Match Your Metrics To Your Goal
Analytics only helps when you match the metric to your actual goal. Reading the wrong numbers creates confident decisions that move in the wrong direction.
If Your Goal Is Growth
The signals that predict continued algorithmic distribution are retention and watch time on YouTube, average watch time and completion rate on TikTok, and saves and shares on Instagram. Average view duration is YouTube’s strongest signal of content quality. Consistent 60% completion prompts wider distribution. Viewers dropping off at 15% suppresses the video.
On TikTok, completion rate is the heaviest ranking factor in 2026, with saves and shares carrying more weight than likes. On Instagram, watch time, sends per reach, and likes per reach are the signals Instagram weights most heavily for Reels distribution.
If Your Goal Is Sponsorship Deals
Brands buy predictable delivery. A single viral spike does not make a creator a reliable sponsorship partner. The metrics that matter are audience demographics, reach consistency across posts, and engagement rate stability.
TikTok leads on engagement rate at 4.25%, followed by Instagram at 0.98%, Facebook at 0.15%, and X at 0.10%, though YouTube’s 1.4–5.2% is measured against views rather than subscribers and is not directly comparable. A creator with erratic performance is worth less to a sponsor than one with steady, lower numbers. Sponsored content typically sees 10–30% lower engagement than organic content from the same creator, so sponsors price based on a creator’s organic floor.
If Your Goal Is Revenue
Revenue per view, click-through from profile or link, and conversion from profile visit to follow or click to sale connect content to money. A creator with 1 million monthly views earns an estimated $1,100–$4,400 on YouTube long-form in broad lifestyle content, $400–$1,000 on TikTok’s Creator Rewards Program, and $0 on Instagram Reels unless invited to a bonus program. View count is the least reliable predictor of income across platforms.
Revenue-per-view would reveal this gap, but most creators never look at it because it is buried one tab deeper than views.
Platform-By-Platform: Where To Find Creator Analytics And What Matters Most
YouTube: YouTube Studio, Analytics Tab
Go to YouTube Studio and open Analytics, with the Audience and Revenue tabs highlighted. The metric that matters most for growth is audience retention and average view duration.
The first 10 seconds of a YouTube video determine whether 20–40% of the audience stays or leaves. The retention graph shows the exact timestamps where viewers drop. For revenue, YouTube long-form RPM ranges from $1.65 to $24.75 per 1,000 views depending on niche. Finance and Business sit at the top and Entertainment at the bottom, so niche choice affects revenue more than view count.
TikTok: TikTok Studio, Analytics Section
The 2026 location for creator performance data is TikTok Studio → Analytics. The metric that matters most is average watch time and completion rate.
TikTok raised its completion-rate bar for viral distribution from roughly 50% in 2024 to roughly 70% in 2026. A video that spread fine last year may now stall. TikTok median completion rate falls sharply with video length: 52% for videos under 15 seconds, 34% for 15–30 seconds, 22% for 30–60 seconds, and 14% for videos over 60 seconds.
TikTok’s Creator Rewards Program pays approximately $0.40–$1.00 per 1,000 qualified views. In EEA terms, a qualified view lasts 5 seconds or more and is counted once per account. This definition is not published in all regional program terms.
Instagram: Instagram Insights
Open Instagram Insights and focus on reach, saves, and shares. The metric that matters most is saves and shares relative to reach.
Instagram save rate benchmarks by content type show educational carousels at 3.5–5.0%, tutorial Reels at 2.0–3.5%, product review Reels at 1.5–2.5%, and lifestyle content at 0.5–1.0%. Save rate is Instagram’s strongest purchase-intent signal. Instagram Insights lets creators select timeframes only within the past 90 days, and audience demographics require reaching over 100 accounts within a preset timeframe to unlock.
Blog or Owned Site: Google Search Console and Site Analytics
Use Google Search Console alongside a site analytics tool. The metric that matters most is which queries and pages bring returning readers, because owned audiences convert without platform risk.
Search Console shows which content earns organic traffic. Site analytics show whether those visitors return. Owned-channel data is first-party by definition. It does not depend on platform algorithm changes or third-party estimates.
The Diagnostic Framework: Metric Moved, Likely Cause, Next Action
Knowing where each metric lives only helps when you know what to do when one moves. When a metric moves, the cause almost always sits upstream of the symptom. A reach drop usually traces back to a hook or cadence problem, not to the reach metric itself.
The table below maps each common metric movement to its likely cause and the single next action that addresses it. When several metrics move at once, check which one changed first chronologically. The earliest change is almost always the root cause, and the later movements are its effects.
| Metric | Likely Cause | Next Action |
|---|---|---|
| Impressions Or Reach Down | Hook or thumbnail underperforming, or posting cadence slipped | Rewrite the first three seconds or the thumbnail and repost the concept in a new format |
| Watch Time Down | Payoff arrives too late or the edit drags | Cut the first ten seconds and move the payoff earlier |
| Engagement Rate Down While Reach Holds | Content is being consumed passively or the CTA is missing | Add one specific question or save prompt |
| Follower Growth Flat While Views Grow | No reason to follow, no series identity | Build a recurring format or series the viewer can subscribe to |
| Revenue Per View Down | Content is reaching a lower-intent audience or the offer does not match the audience | Align the offer to the demographic actually watching |
Ready to act on what the table tells you? Connect your analytics to your next shoot.
Free Vs. Paid Analytics: What Native Dashboards Measure And What Tools Estimate
Native dashboards such as YouTube Studio, TikTok Studio, and Instagram Insights are the only source of truth for retention, watch time, and revenue because they are first-party. Third-party YouTube analytics tools cannot directly access a creator’s own CTR, retention, revenue, or audience demographics. Revenue figures are estimated only, traffic sources and search terms are limited or estimated, and demographics are limited. No third-party tool has authenticated access to a competitor’s private metrics.
Third-party tools such as SocialBlade, Metricool, and HypeAuditor help with historical trends, cross-channel comparison, and estimating another creator’s performance. Their numbers are estimates, not measurements. Match rates between third-party data segments and real audience behavior were often well under 50%, and the deprecation of cookies and mobile ad IDs has made matching even worse.
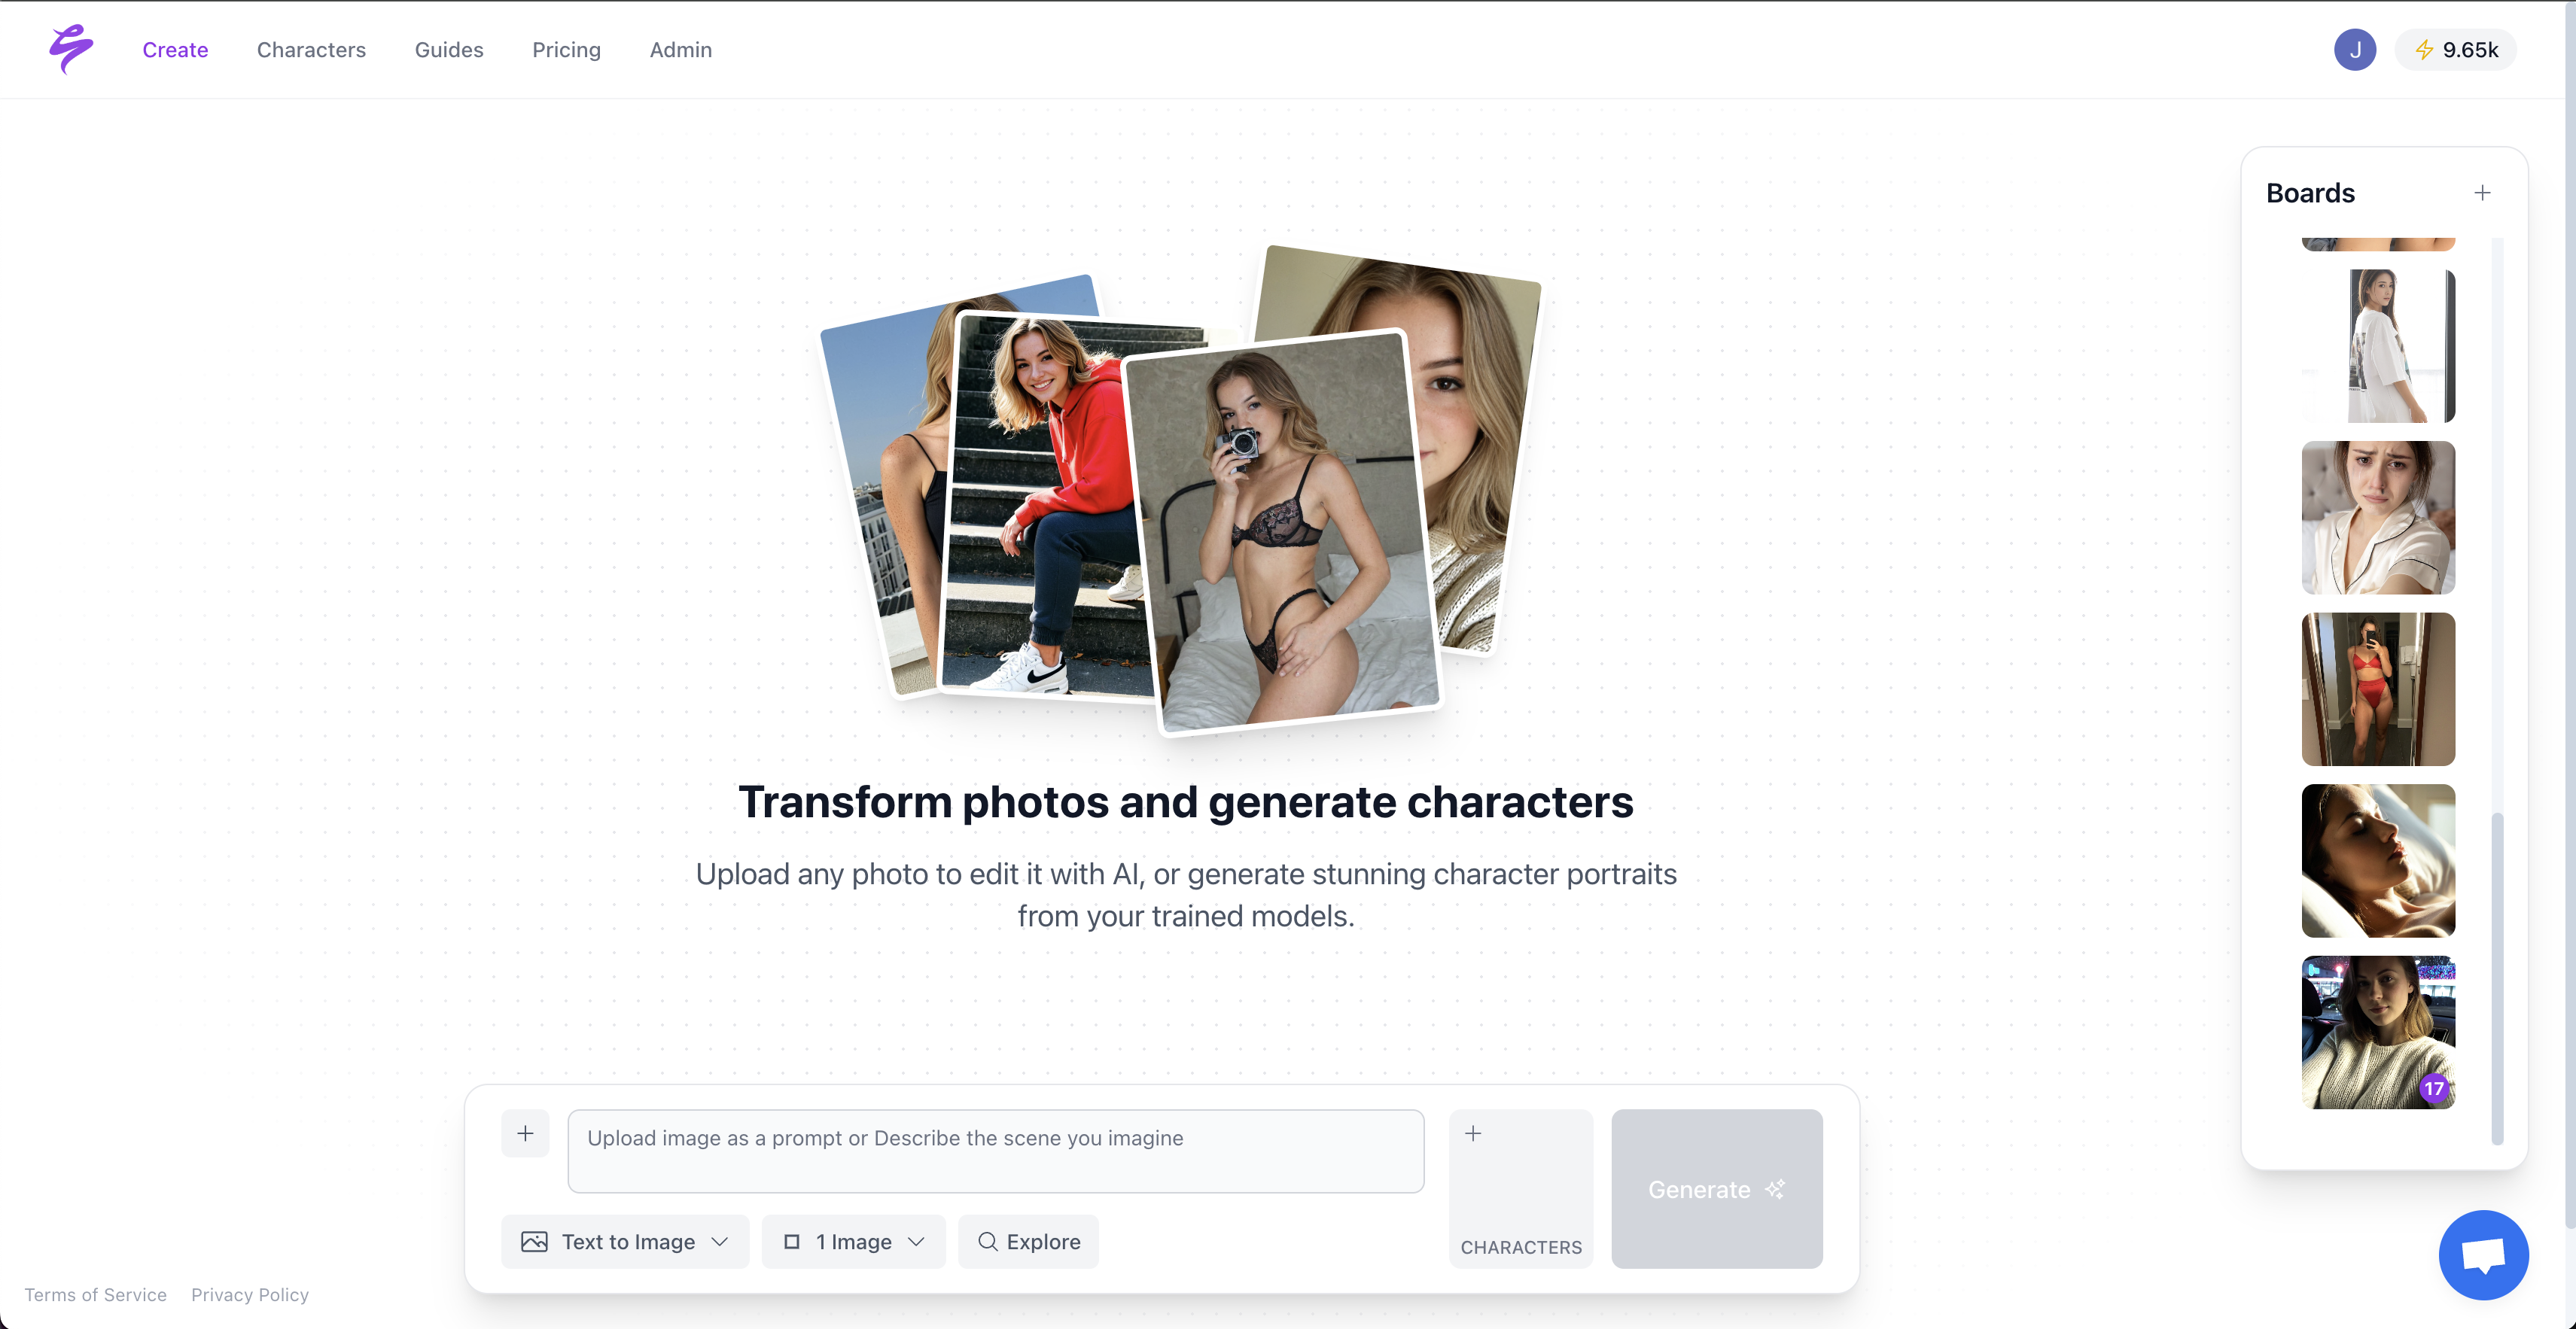
Sozee’s Analytics tracks impressions, reach, likes, comments, shares, and engagement. It also splits what Sozee posted from what the creator posted, so you can see exactly what the studio contributed. This answers the “is this working” question that third-party tools cannot answer.
Benchmarking Against Other Creators: How To Use Third-Party Estimates
Third-party tools estimate another channel’s views and growth from public signals. No third-party tool can see another creator’s retention, watch time, or revenue because these private metrics are never accessible externally, though tools can access a creator’s own data via official sign-in. Use competitor benchmarking for format and topic ideas only. Avoid using it as a performance target, because you cannot see the inputs behind someone else’s output.
Platform-level creator benchmarks shift meaningfully every 6–12 months, so static tables go stale quickly. For a working reference, TikTok micro-tier (10K–100K) median engagement rate is 6.2%, Instagram Reels micro-tier median is 4.4%, and YouTube long-form micro-tier thumbnail CTR benchmark is 4–7%. These are medians. Half of creators in each tier fall below them.
Audience Demographics And Conversion Metrics That Drive Earnings
Audience demographics such as age, geography, and gender in YouTube Studio’s Audience tab and TikTok Studio’s follower insights show who is actually watching. Conversion metrics show whether that audience turns into revenue. The same is true of demographics and conversion metrics: they sit one layer below the surface metrics most creators check.
Three variables drive earnings divergence within any single platform: audience geography, content niche, and monetization mix. A creator with a US-heavy audience in a finance niche combining view payouts, brand deals, and affiliate income can out-earn a creator with identical view counts in entertainment by a factor of roughly five to ten or more. Mid-tier creators (50K–500K followers) earn $2,406 per sponsored post on Instagram, $4,500 on TikTok, and $14,437 on YouTube. Platform choice is the single largest variable in sponsorship pricing at every follower tier.
Sozee’s Scheduler connects Instagram, TikTok, X, Facebook, Reddit, and Fanvue per character. Posting cadence, a frequent cause behind reach drops, is controlled in the same place the analytics are read.
What To Check Weekly Vs. Monthly
Analytics review cadence matters as much as the metrics themselves. Checking analytics more frequently than weekly typically generates anxiety without actionable insight.
Check Weekly:
- Reach and impressions, the fast signal for hook and thumbnail performance
- Watch time or completion rate, the signal for content quality and pacing
- Saves and shares, the signal for out-of-network distribution on Instagram
- Follower growth, the signal for whether content is building an audience or just reaching one
Check Monthly:
- Audience demographics, to confirm the audience matches the monetization strategy
- Revenue per view, to track whether niche or format shifts affect earnings
- Conversion rates, such as profile visit to follow and link click to sale
- Which formats or series are compounding over time
Frequently Asked Questions
How Do I Get to Creator Analytics on TikTok?
Open TikTok Studio and navigate to the Analytics section. As of 2026, TikTok’s native creator performance analytics live inside TikTok Studio, the creator hub that replaced the older Creator Tools flow. Access it via Profile > Menu > TikTok Studio > Analytics. TikTok Studio offers up to 60 days of data on video performance, follower growth, and audience demographics. Business accounts access equivalent analytics through Business Suite.
- Overview shows total video views, profile views, and net follower change over a selectable period (7 days, 28 days, 60 days, or a custom range).
- Content shows per-video performance including average watch time and completion rate, the two metrics most directly tied to algorithmic distribution.
- Followers shows audience demographics including top territories, gender breakdown, and the hours when your followers are most active. The last data point is the most actionable for scheduling decisions.
Is There a Free Tool for Content Creator Analytics?
Yes. Native dashboards are free and act as the source of truth. YouTube Studio, TikTok Studio, and Instagram Insights provide first-party data on retention, watch time, and revenue at no cost. As covered above, native dashboards are the only first-party source for these metrics.
These tools show your actual retention curve, your exact revenue per view, and your real audience demographics. Third-party tools add estimation and cross-channel comparison but cannot replace native data for any of those three metrics. For creators under 1,000 subscribers or followers, the free native stack is the right starting point. There is not enough upload history for A/B testing tools to produce statistically meaningful results at that stage.
Is SocialBlade Still Worth Using in 2026?
SocialBlade still helps with directional historical trends and cross-channel comparison. It does not help with retention or revenue, which only first-party dashboards show.
SocialBlade’s free tier tracks public subscriber and view trends for any YouTube channel, showing 90 days of historical data with basic growth grade scoring and estimated monthly earnings ranges. It cannot surface which specific videos drove growth spikes or which topics generate the most engagement. Treat SocialBlade data as directional, not exact. Growth spike patterns visible in the charts can also indicate purchased followers, which makes it a useful fraud-detection signal when evaluating other creators for collaboration or benchmarking.
What Is a Good Engagement Rate for a Creator with 10K–100K Followers?
Benchmarks vary significantly by platform and format. For micro-tier creators (10K–100K followers), healthy planning ranges are: TikTok median engagement rate of 6.2% with a 75th percentile of 9.7%; Instagram Reels median of 4.4% with a 75th percentile of 7.2%; Instagram feed posts median of 2.5%; and YouTube long-form like-to-view ratio of 3–5%.
Engagement rate naturally declines as account size grows, so creators should benchmark against accounts of similar size rather than against platform-wide averages. As noted earlier, sponsored content typically performs below a creator’s organic baseline, which is why brands set campaign expectations from your organic engagement rate, not your sponsored numbers.
Why Did My Reach Drop and What Should I Do First?
Diagnose in order before changing anything. On Instagram, check Settings → Account Status for recommendation eligibility. This takes two minutes and rules out a policy issue before you change your content strategy.
On TikTok, check Settings → Account → Violations for any content notices, then compare completion rate on your last seven days against your prior 30-day average. On YouTube, open the audience retention graph for your last three videos and look for the timestamp where the steepest drop occurs.
In most cases, a reach drop traces to one of three causes: a hook or thumbnail that is not earning the click, a pacing problem that loses viewers before the payoff, or a gap in posting cadence that caused the algorithm to recalibrate. Apply the chronological check from the diagnostic framework: the first metric to move is almost always the root cause.
Analytics Without Production Is Just A Dashboard
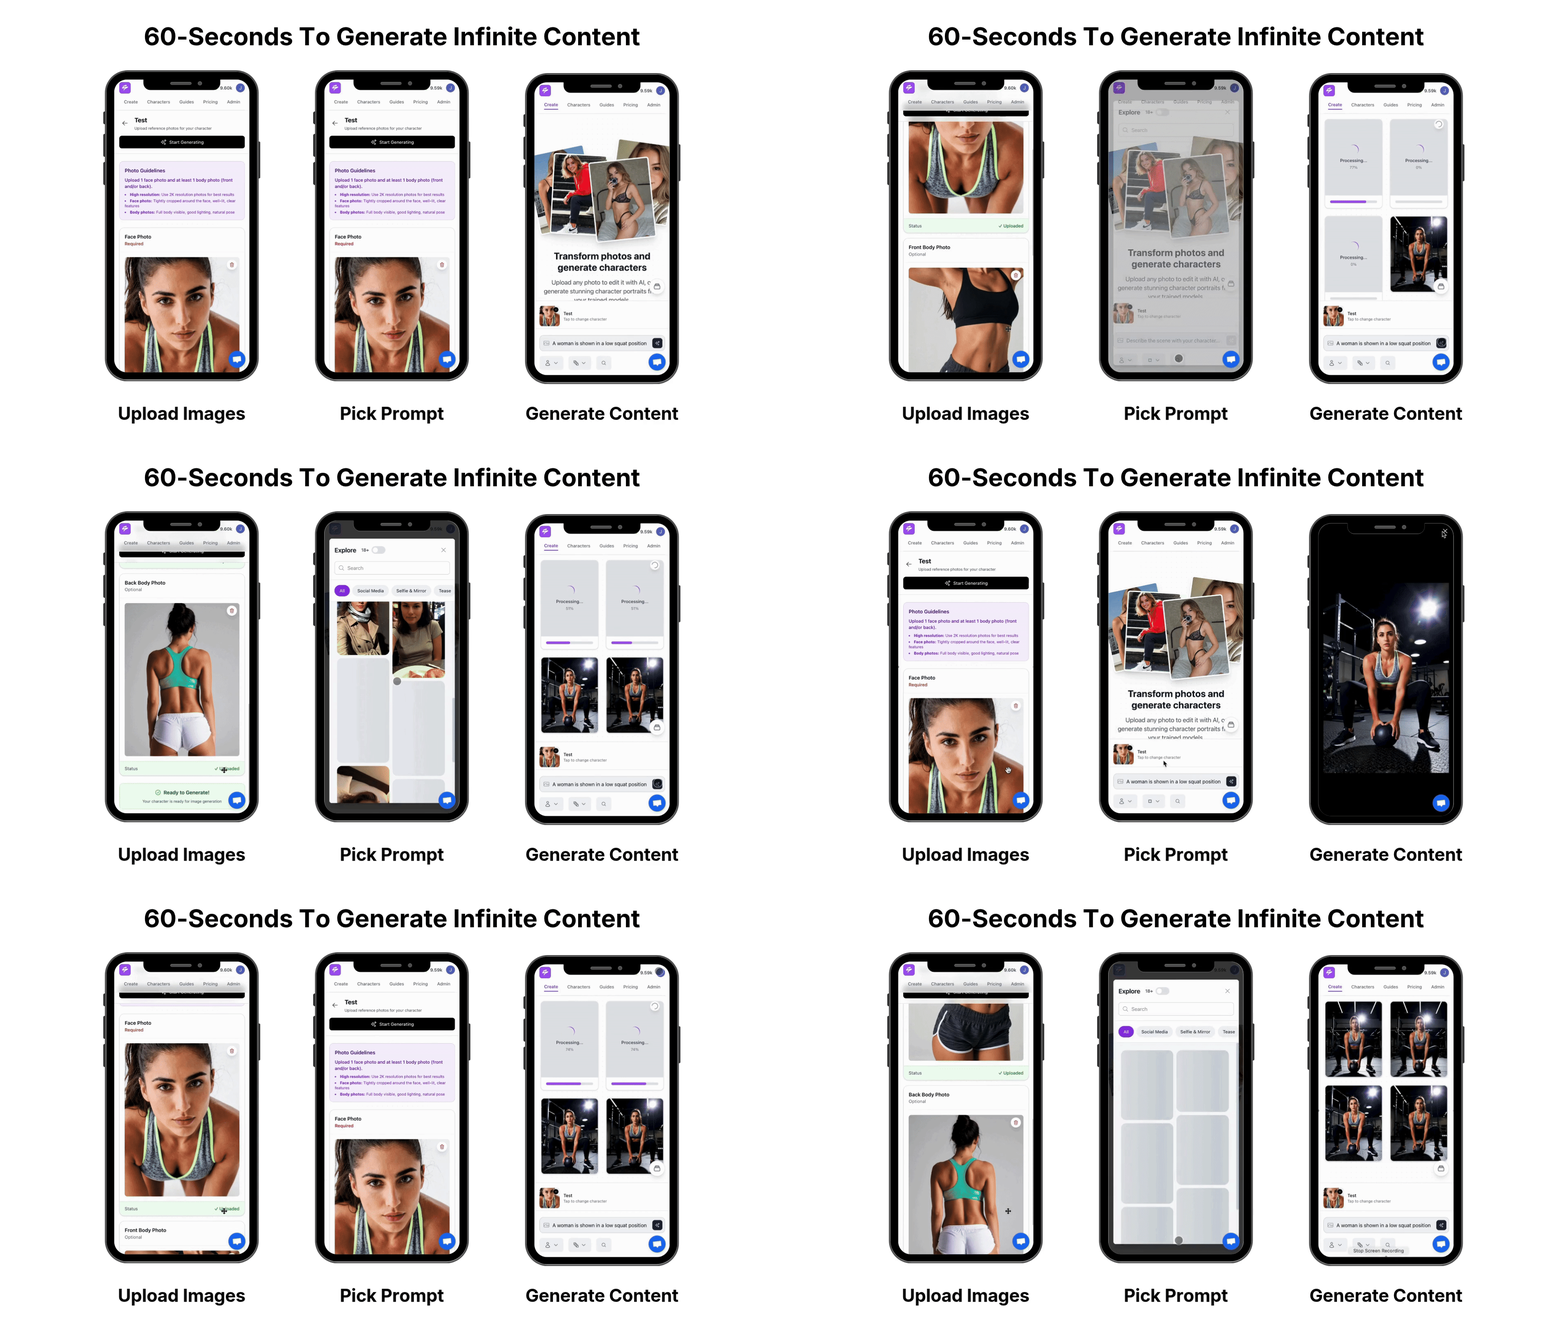
Pick the metrics that match your goal, read them in the native dashboard that owns them, run the metric → cause → action diagnostic, and then produce the next post. General-purpose AI tools give you a prompt box without any way to measure results. Third-party analytics tools measure results but stop short of production. Sozee is the only platform that closes the loop from measurement to published content.
Sozee’s Agent reads your characters, library, and performance, then proposes and produces the next shoot. The Scheduler controls posting cadence across Instagram, TikTok, X, Facebook, Reddit, and Fanvue. The locked likeness and reusable environments mean that when a format works, you can reproduce it exactly with the same face, same room, and same look without reshooting anything. Sozee’s Analytics splits what Sozee posted from what you posted, so you can see exactly what the studio contributed to your numbers.
Stop measuring without producing. Close the loop from analytics to your next post.